|
|
|
|
|
|
|
|
|
|
|
|
|
|
|
|
|
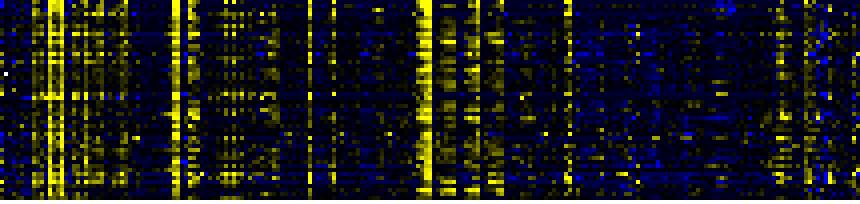
| Pathways co-expressed in the Organ and Tissue data set (with more than 6 annotation points) |
|
CYP76C2 (At2g45570) |
|
|
|
|
|
|
|
|
| max. difference between log2-ratios: |
6.8 |
|
|
|
|
|
|
|
|
|
|
|
|
| max. difference between log2-ratios excluding lowest and highest 5%: |
4.8 |
|
|
|
|
|
|
|
|
|
|
|
|
| Pathway |
Source |
Scores of Genes |
p[Score] |
No. of Genes |
p[genes] |
Link to organ heatmap |
|
|
|
|
|
|
|
| toxin catabolism |
TAIR-GO |
14 |
0.000 |
3 |
0.000 |
|
|
|
|
|
|
|
|
|
|
|
| lignin biosynthesis |
AraCyc |
12 |
0.000 |
2 |
0.001 |

|
|
|
| Glutathione metabolism |
KEGG |
12 |
0.000 |
2 |
0.000 |
|
|
| Phenylpropanoid pathway |
LitPath |
12 |
0.000 |
2 |
0.000 |
|
|
| Phenylpropanoid Metabolism |
BioPath |
11 |
0.000 |
2 |
0.030 |
|
|
| Biosynthesis of Amino Acids and Derivatives |
BioPath |
10 |
0.002 |
1 |
0.148 |
|
|
| core phenylpropanoid metabolism |
BioPath |
10 |
0.000 |
1 |
0.014 |
|
|
|
|
|
|
|
|
|
|
|
| Glutathione metabolism |
BioPath |
10 |
0.000 |
1 |
0.032 |
|
|
|
|
|
|
|
|
|
|
|
| lignin biosynthesis |
TAIR-GO |
10 |
0.000 |
1 |
0.000 |
|
|
|
|
|
|
|
|
|
|
|
| Stilbene, coumarine and lignin biosynthesis |
KEGG |
10 |
0.000 |
1 |
0.021 |
|
|
|
|
|
|
|
|
|
|
|
| hyperosmotic salinity response |
TAIR-GO |
9 |
0.000 |
1 |
0.000 |
|
|
|
|
|
|
|
|
|
|
|
| proline biosynthesis |
TAIR-GO |
9 |
0.000 |
1 |
0.000 |
|
|
|
|
|
|
|
|
|
|
|
| arginine degradation II |
AraCyc |
9 |
0.000 |
1 |
0.004 |
|
|
|
|
|
|
|
|
|
|
|
| arginine degradation III |
AraCyc |
9 |
0.000 |
1 |
0.001 |
|
|
|
|
|
|
|
|
|
|
|
| arginine degradation V |
AraCyc |
9 |
0.000 |
1 |
0.002 |
|
|
|
|
|
|
|
|
|
|
|
| biosynthesis of proto- and siroheme |
AraCyc |
9 |
0.000 |
1 |
0.019 |
|
|
|
|
|
|
|
|
|
|
|
| biotin biosynthesis I |
AraCyc |
9 |
0.000 |
1 |
0.001 |
|
|
|
|
|
|
|
|
|
|
|
| chlorophyll biosynthesis |
AraCyc |
9 |
0.000 |
1 |
0.030 |
|
|
|
|
|
|
|
|
|
|
|
| glutamate degradation I |
AraCyc |
9 |
0.000 |
1 |
0.001 |
|
|
|
|
|
|
|
|
|
|
|
| lysine biosynthesis I |
AraCyc |
9 |
0.000 |
1 |
0.003 |
|
|
|
|
|
|
|
|
|
|
|
| amino acid metabolism |
FunCat |
9 |
0.000 |
1 |
0.020 |
|
|
|
|
|
|
|
|
|
|
|
| Arginine and proline metabolism |
KEGG |
9 |
0.000 |
1 |
0.004 |
|
|
|
|
|
|
|
|
|
|
|
| Urea cycle and metabolism of amino groups |
KEGG |
9 |
0.000 |
1 |
0.001 |
|
|
|
|
|
|
|
|
|
|
|
| C-compound and carbohydrate utilization |
FunCat |
8 |
0.000 |
2 |
0.000 |
|
|
|
|
|
|
|
|
|
|
|
|
|
|
|
|
|
|
|
|
|
|
|
|
|
|
|
|
|
|
|
|
|
|
|
|
|
|
|
|
|
|
|
|
|
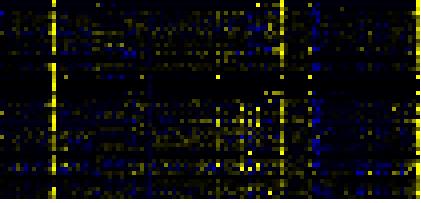
| Pathways co-expressed in the Stress data set ( with more than 20 annotation points) |
|
CYP76C2 (At2g45570) |
|
|
|
|
|
|
|
|
| max. difference between log2-ratios: |
8.6 |
|
|
|
|
|
|
|
|
|
|
|
|
| max. difference between log2-ratios excluding lowest and highest 5%: |
3.9 |
|
|
|
|
|
|
|
|
|
|
|
|
| Pathway |
Source |
Scores of Genes |
p[Score] |
No. of Genes |
p[genes] |
Link to stress heatmap |
|
|
|
|
|
|
|
| Intermediary Carbon Metabolism |
BioPath |
74 |
0.000 |
14 |
0.000 |
|
|
|
|
|
|
|
|
|
|
|
| C-compound and carbohydrate metabolism |
FunCat |
68 |
0.000 |
14 |
0.002 |
|
| Phenylpropanoid Metabolism |
BioPath |
66 |
0.000 |
10 |
0.013 |
| Gluconeogenesis from lipids in seeds |
BioPath |
65 |
0.000 |
8 |
0.000 |
| Biosynthesis of Amino Acids and Derivatives |
BioPath |
54 |
0.001 |
6 |
0.232 |
| Citrate cycle (TCA cycle) |
KEGG |
52 |
0.000 |
8 |
0.000 |
| Degradation of storage lipids and straight fatty acids |
AcylLipid |
51 |
0.000 |
7 |
0.000 |
| tricarboxylic-acid pathway (citrate cycle, Krebs cycle, TCA cycle) |
FunCat |
42 |
0.000 |
7 |
0.004 |
| Fatty acid metabolism |
KEGG |
40 |
0.000 |
7 |
0.000 |
| Phenylpropanoid pathway |
LitPath |
38 |
0.000 |
7 |
0.001 |
| fatty acid beta oxidation complex |
BioPath |
37 |
0.000 |
4 |
0.000 |
| amino acid metabolism |
FunCat |
37 |
0.000 |
5 |
0.047 |
| TCA cycle -- aerobic respiration |
AraCyc |
36 |
0.000 |
6 |
0.003 |
| Glutathione metabolism |
KEGG |
36 |
0.000 |
5 |
0.006 |
| Glutamate metabolism |
KEGG |
35 |
0.000 |
4 |
0.029 |
|
|
|
|
|
|
|
|
|
|
|
| core phenylpropanoid metabolism |
BioPath |
34 |
0.000 |
5 |
0.002 |
|
|
|
|
|
|
|
|
|
|
|
| acetyl-CoA assimilation |
AraCyc |
32 |
0.000 |
5 |
0.002 |
|
|
|
|
|
|
|
|
|
|
|
| TCA cycle variation VII |
AraCyc |
32 |
0.000 |
5 |
0.066 |
|
|
|
|
|
|
|
|
|
|
|
| TCA cycle variation VIII |
AraCyc |
32 |
0.000 |
5 |
0.014 |
|
|
|
|
|
|
|
|
|
|
|
| Arginine and proline metabolism |
KEGG |
32 |
0.000 |
5 |
0.006 |
|
|
|
|
|
|
|
|
|
|
|
| Glyoxylate and dicarboxylate metabolism |
KEGG |
32 |
0.000 |
5 |
0.001 |
|
|
|
|
|
|
|
|
|
|
|
| glyoxylate cycle |
AraCyc |
28 |
0.000 |
4 |
0.002 |
|
|
|
|
|
|
|
|
|
|
|
| serine-isocitrate lyase pathway |
AraCyc |
28 |
0.000 |
4 |
0.036 |
|
|
|
|
|
|
|
|
|
|
|
| lignin biosynthesis |
AraCyc |
26 |
0.000 |
5 |
0.008 |
|
|
|
|
|
|
|
|
|
|
|
| TCA cycle variation IV |
AraCyc |
26 |
0.000 |
4 |
0.036 |
|
|
|
|
|
|
|
|
|
|
|
| Glutathione metabolism |
BioPath |
24 |
0.005 |
3 |
0.153 |
|
|
|
|
|
|
|
|
|
|
|
| lipid, fatty acid and isoprenoid degradation |
FunCat |
24 |
0.000 |
4 |
0.001 |
|
|
|
|
|
|
|
|
|
|
|
| Glycolysis / Gluconeogenesis |
KEGG |
24 |
0.045 |
5 |
0.091 |
|
|
|
|
|
|
|
|
|
|
|
| Nucleotide Metabolism |
KEGG |
24 |
0.012 |
3 |
0.372 |
|
|
|
|
|
|
|
|
|
|
|
| Pyruvate metabolism |
KEGG |
24 |
0.045 |
5 |
0.070 |
|
|
|
|
|
|
|
|
|
|
|
| mixed acid fermentation |
AraCyc |
22 |
0.000 |
4 |
0.013 |
|
|
|
|
|
|
|
|
|
|
|
| C-compound and carbohydrate utilization |
FunCat |
22 |
0.000 |
3 |
0.000 |
|
|
|
|
|
|
|
|
|
|
|
| Stilbene, coumarine and lignin biosynthesis |
KEGG |
22 |
0.024 |
3 |
0.577 |
|
|
|
|
|
|
|
|
|
|
|
|
|
|
|
|
|
|
|
|
|
|
|
|
|
|
|
|
|
|
|
|
|
|
|
|
|
|
|
|
|
|
|
|
|
| Pathways co-expressed in the Hormone etc. data set (with more than 10 annotation points) |
|
CYP76C2 (At2g45570) |
|
|
|
|
|
|
|
|
| max. difference between log2-ratios: |
3.8 |
|
|
|
|
|
|
|
|
|
|
|
|
| max. difference between log2-ratios excluding lowest and highest 5%: |
0.0 |
|
|
|
|
|
|
|
|
|
|
|
|
| Pathway |
Source |
Scores of Genes |
p[Score] |
No. of Genes |
p[genes] |
Link to hormones etc. heatmap |
|
|
|
|
|
|
|
| Phenylpropanoid Metabolism |
BioPath |
45 |
0.000 |
7 |
0.002 |
|
|
|
|
|
|
|
|
|
|
|
| Phenylpropanoid pathway |
LitPath |
28 |
0.000 |
5 |
0.000 |
|
|
|
|
|
|
| core phenylpropanoid metabolism |
BioPath |
26 |
0.000 |
4 |
0.000 |
|
|
|
|
|
| Gluconeogenesis from lipids in seeds |
BioPath |
26 |
0.000 |
4 |
0.002 |
|
|
|
|
|
| biogenesis of cell wall |
FunCat |
24 |
0.000 |
3 |
0.004 |
|
|
|
|
|
| Miscellaneous acyl lipid metabolism |
AcylLipid |
22 |
0.000 |
5 |
0.006 |
|
|
|
|
|
| Fatty acid metabolism |
KEGG |
20 |
0.000 |
2 |
0.004 |
|
|
|
|
|
| Glutathione metabolism |
KEGG |
20 |
0.000 |
4 |
0.000 |
|
|
|
|
|
| degradation of abscisic acid |
LitPath |
20 |
0.000 |
2 |
0.000 |
|
|
|
|
|
| ascorbate glutathione cycle |
AraCyc |
18 |
0.000 |
2 |
0.002 |
|
|
|
|
|
| Arginine and proline metabolism |
KEGG |
18 |
0.000 |
3 |
0.001 |
|
|
|
|
|
| Glutamate metabolism |
KEGG |
17 |
0.000 |
3 |
0.001 |
|
|
|
|
|
| polyamine biosynthesis |
TAIR-GO |
16 |
0.000 |
2 |
0.000 |
|
|
|
|
|
| polyamine biosynthesis I |
AraCyc |
16 |
0.000 |
2 |
0.008 |
|
|
|
|
|
|
|
|
|
|
|
| polyamine biosynthesis II |
AraCyc |
16 |
0.000 |
2 |
0.002 |
|
|
|
|
|
|
|
|
|
|
|
| polyamine biosynthesis III |
AraCyc |
16 |
0.000 |
2 |
0.001 |
|
|
|
|
|
|
|
|
|
|
|
| spermine biosynthesis I |
AraCyc |
16 |
0.000 |
2 |
0.001 |
|
|
|
|
|
|
|
|
|
|
|
| Glutathione metabolism |
BioPath |
14 |
0.004 |
2 |
0.074 |
|
|
|
|
|
|
|
|
|
|
|
| lignin biosynthesis |
AraCyc |
14 |
0.000 |
3 |
0.004 |
|
|
|
|
|
|
|
|
|
|
|
| transcription |
FunCat |
14 |
0.000 |
2 |
0.000 |
|
|
|
|
|
|
|
|
|
|
|
| Phenylalanine, tyrosine and tryptophan biosynthesis |
KEGG |
14 |
0.000 |
3 |
0.001 |
|
|
|
|
|
|
|
|
|
|
|
| fatty acid beta oxidation complex |
BioPath |
12 |
0.000 |
2 |
0.003 |
|
|
|
|
|
|
|
|
|
|
|
| alanine biosynthesis II |
AraCyc |
12 |
0.000 |
2 |
0.006 |
|
|
|
|
|
|
|
|
|
|
|
| phenylalanine biosynthesis II |
AraCyc |
12 |
0.000 |
2 |
0.004 |
|
|
|
|
|
|
|
|
|
|
|
|
|
|
|
|
|
|
|
|
|
|
|
|
|
|
|
|