| _________________________________________ |
|
|
|
|
|
|
|
|
|
|
|
|
|
|
|
|
| Pathways co-expressed in the 2 data sets with co-expressed pathways (with more than 6 annotation points each) |
|
Find below a list of pathways that are co-expressed with the bait. First a list of pathways is given that are co-expressed in all data sets. Lists for each individual dataset are shown underneath. Depending on the number of co-expressed pathways only the top scoring pathways are given; all data can be saved as text using the link above. |

|
|
|
|
|
|
|
| Pathway |
Source |
Sum of scores |
Sum of genes |
|
|
|
|
|
|
|
| glycolysis and gluconeogenesis |
FunCat |
30 |
5 |
|
|
|
|
|
|
|
| Intermediary Carbon Metabolism |
BioPath |
26 |
3 |
|
|
|
|
|
|
|
| glyoxylate cycle |
AraCyc |
26 |
3 |
|
|
|
|
|
|
|
| Glyoxylate and dicarboxylate metabolism |
KEGG |
26 |
3 |
|
To the right of each table a thumbnail of the actual co-expression heatmap is given. Klick on the link to see the heatmap containing all co-expressed genes. |
|
|
|
|
|
|
|
|
| glyoxylate cycle |
AraCyc |
26 |
3 |
|
|
|
|
|
|
|
|
|
| Carbon fixation |
KEGG |
20 |
3 |
|
|
|
|
|
|
|
|
|
| secondary metabolism |
FunCat |
17 |
2 |
|
For more information on how these pathway maps were generated please read the methods page |
|
|
|
|
|
|
|
|
|
|
|
|
|
|
|
|
|
|
|
|
|
|
|
|
|
|
|
|
|
|
|
|
|
|
|
|
|
|
|
|
|
|
|
|
|
|
|
|
|
|
|
|
|
|
|
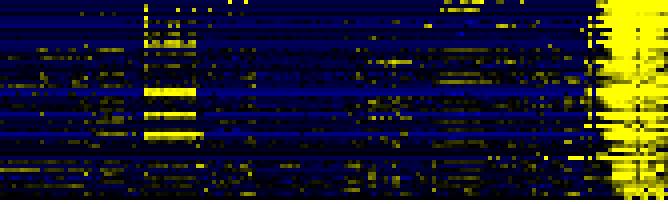
| Pathways co-expressed in the Organ and Tissue data set (with more than 10 annotation points) |
|
CYP78A7 (At5g09970) |
|
|
|
|
|
|
|
|
| max. difference between log2-ratios: |
8.0 |
|
|
|
|
|
|
|
|
|
|
|
|
| max. difference between log2-ratios excluding lowest and highest 5%: |
5.8 |
|
|
|
|
|
|
|
|
|
|
|
|
| Pathway |
Source |
Scores of Genes |
p[Score] |
No. of Genes |
p[genes] |
Link to organ heatmap |
|
|
|
|
|
|
|
| Synthesis and storage of oil |
AcylLipid |
38 |
0.000 |
10 |
0.000 |
|
|
|
| Miscellaneous acyl lipid metabolism |
AcylLipid |
25 |
0.015 |
5 |
0.617 |
|
|
| gibberellic acid biosynthesis |
TAIR-GO |
20 |
0.000 |
2 |
0.000 |
|
|
| plant / fungal specific systemic sensing and response |
FunCat |
20 |
0.000 |
2 |
0.002 |
|
|
| plant hormonal regulation |
FunCat |
20 |
0.000 |
2 |
0.002 |
|
|
| Diterpenoid biosynthesis |
KEGG |
20 |
0.000 |
2 |
0.000 |
|
|
| Pyruvate metabolism |
KEGG |
20 |
0.000 |
3 |
0.005 |
|
|
| Gibberellin metabolism |
LitPath |
20 |
0.000 |
2 |
0.003 |
|
|
| giberelin biosynthesis |
LitPath |
20 |
0.000 |
2 |
0.001 |
|
|
| acyl-CoA binding |
TAIR-GO |
19 |
0.000 |
2 |
0.000 |
|
|
| lipid transport |
TAIR-GO |
19 |
0.000 |
2 |
0.000 |
|
|
| Intermediary Carbon Metabolism |
BioPath |
16 |
0.000 |
2 |
0.098 |
|
|
| glyoxylate cycle |
AraCyc |
16 |
0.000 |
2 |
0.013 |
|
|
|
|
|
|
|
|
|
|
|
| TCA cycle variation VII |
AraCyc |
16 |
0.000 |
2 |
0.191 |
|
|
|
|
|
|
|
|
|
|
|
| TCA cycle variation VIII |
AraCyc |
16 |
0.000 |
2 |
0.088 |
|
|
|
|
|
|
|
|
|
|
|
| glycolysis and gluconeogenesis |
FunCat |
16 |
0.002 |
3 |
0.071 |
|
|
|
|
|
|
|
|
|
|
|
| Glyoxylate and dicarboxylate metabolism |
KEGG |
16 |
0.000 |
2 |
0.002 |
|
|
|
|
|
|
|
|
|
|
|
| Gluconeogenesis from lipids in seeds |
BioPath |
13 |
0.000 |
2 |
0.012 |
|
|
|
|
|
|
|
|
|
|
|
| Biosynthesis of Amino Acids and Derivatives |
BioPath |
12 |
0.003 |
2 |
0.112 |
|
|
|
|
|
|
|
|
|
|
|
|
|
|
|
|
|
|
|
|
|
|
|
|
|
|
|
|
|
|
|
|
|
|
|
|
|
|
|
|
|
|
|
|
|
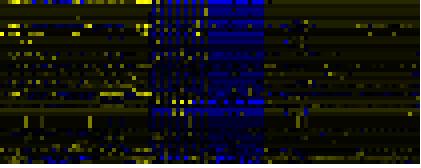
| Pathways co-expressed in the Hormone etc. data set (with more than 6 annotation points) |
|
CYP78A7 (At5g09970) |
|
|
|
|
|
|
|
|
| max. difference between log2-ratios: |
7.3 |
|
|
|
|
|
|
|
|
|
|
|
|
| max. difference between log2-ratios excluding lowest and highest 5%: |
5.2 |
|
|
|
|
|
|
|
|
|
|
|
|
| Pathway |
Source |
Scores of Genes |
p[Score] |
No. of Genes |
p[genes] |
Link to hormones etc. heatmap |
|
|
|
|
|
|
|
| triterpene, sterol, and brassinosteroid metabolism |
LitPath |
15 |
0.000 |
3 |
0.023 |
|
|
|
|
|
|
| C-compound and carbohydrate metabolism |
FunCat |
14 |
0.000 |
2 |
0.090 |
|
|
|
|
|
| glycolysis and gluconeogenesis |
FunCat |
14 |
0.000 |
2 |
0.011 |
|
|
|
|
|
| Phenylpropanoid Metabolism |
BioPath |
12 |
0.000 |
2 |
0.047 |
|
|
|
|
|
| Glucosyltransferases for benzoic acids |
BioPath |
10 |
0.000 |
1 |
0.002 |
|
|
|
|
|
| Intermediary Carbon Metabolism |
BioPath |
10 |
0.000 |
1 |
0.177 |
|
|
|
|
|
| Calvin cycle |
AraCyc |
10 |
0.000 |
1 |
0.012 |
|
|
|
|
|
| C-compound and carbohydrate utilization |
FunCat |
10 |
0.000 |
1 |
0.000 |
|
|
|
|
|
| photosynthesis |
FunCat |
10 |
0.000 |
1 |
0.014 |
|
|
|
|
|
| Carbon fixation |
KEGG |
10 |
0.000 |
1 |
0.064 |
|
|
|
|
|
| Glyoxylate and dicarboxylate metabolism |
KEGG |
10 |
0.000 |
1 |
0.014 |
|
|
|
|
|
|
|
|
|
|
|
| brassinosteroid metabolism |
TAIR-GO |
9 |
0.000 |
1 |
0.000 |
|
|
|
|
|
|
|
|
|
|
|
| response to light |
TAIR-GO |
9 |
0.000 |
1 |
0.017 |
|
|
|
|
|
|
|
|
|
|
|
| brassinosteroid degradation |
LitPath |
9 |
0.000 |
1 |
0.000 |
|
|
|
|
|
|
|
|
|
|
|
| triacylglycerol degradation |
AraCyc |
8 |
0.000 |
4 |
0.000 |
|
|
|
|
|
|
|
|
|
|
|
| auxin mediated signaling pathway |
TAIR-GO |
7 |
0.000 |
1 |
0.000 |
|
|
|
|
|
|
|
|
|
|
|
| growth |
TAIR-GO |
7 |
0.000 |
1 |
0.007 |
|
|
|
|
|
|
|
|
|
|
|
| response to auxin stimulus |
TAIR-GO |
7 |
0.000 |
1 |
0.001 |
|
|
|
|
|
|
|
|
|
|
|
| unidimensional cell growth |
TAIR-GO |
7 |
0.000 |
1 |
0.002 |
|
|
|
|
|
|
|
|
|
|
|
|
|
|
|
|
|
|
|
|
|
|
|
|
|
|
|
|