| _________________________________________ |
|
|
|
|
|
|
|
|

|
|
|
|
|
|
|
| Pathways co-expressed in all 4 data sets (with more than 6 annotation points each) |
|
Find below a list of pathways that are co-expressed with the bait. First a list of pathways is given that are co-expressed in all data sets. Lists for each individual dataset are shown underneath. Depending on the number of co-expressed pathways only the top scoring pathways are given; all data can be saved as text using the link above. |
|
|
|
|
|
|
| Pathway |
Source |
Sum of scores |
Sum of genes |
|
|
|
|
|
|
|
| Glucosinolate Metabolism |
LitPath |
280 |
28 |
|
|
|
|
|
|
|
| Biosynthesis of Amino Acids and Derivatives |
BioPath |
242 |
33 |
|
|
|
|
|
|
|
|
|
| tryptophan biosynthesis |
TAIR-GO |
226 |
25 |
|
|
|
|
|
|
|
|
|
| tryptophan biosynthesis |
AraCyc |
218 |
25 |
|
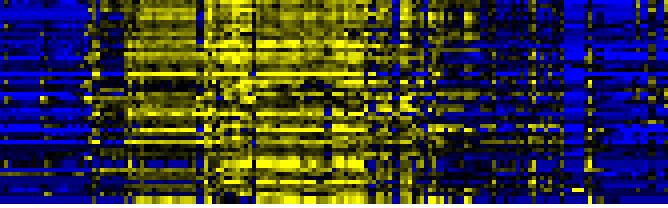
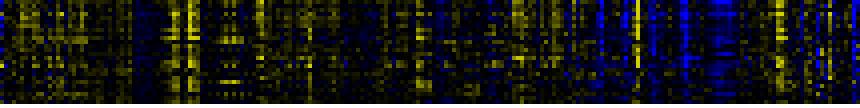
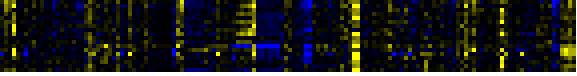
To the right of each table a thumbnail of the actual co-expression heatmap is given. Klick on the link to see the heatmap containing all co-expressed genes. |
|
|
|
|
|
|
|
|
| Phenylpropanoid Metabolism |
BioPath |
213 |
26 |
|
|
|
|
|
|
|
|
|
| Glutathione metabolism |
BioPath |
196 |
27 |
|
|
|
|
|
|
|
|
|
| Glutathione metabolism |
KEGG |
142 |
21 |
|
For more information on how these pathway maps were generated please read the methods page |
|
|
|
|
|
|
|
|
| Phenylalanine, tyrosine and tryptophan biosynthesis |
KEGG |
132 |
14 |
|
|
|
|
|
|
|
|
|
| Sulfur metabolism |
KEGG |
128 |
14 |
|
|
|
|
|
|
|
|
|
|
|
|
|
| Aromatic amino acid (Phe, Tyr, Trp) metabolism |
BioPath |
126 |
14 |
|
|
|
|
|
|
|
|
|
|
|
|
|
| Shikimate pathway |
LitPath |
124 |
13 |
|
|
|
|
|
|
|
|
|
|
|
|
|
| Selenoamino acid metabolism |
KEGG |
114 |
13 |
|
|
|
|
|
|
|
|
|
|
|
|
|
| glucosinolate biosynthesis from tryptophan |
AraCyc |
110 |
11 |
|
|
|
|
|
|
|
|
|
|
|
|
|
| Trp biosyntesis |
LitPath |
110 |
11 |
|
|
|
|
|
|
|
|
|
|
|
|
|
| Purine metabolism |
KEGG |
84 |
9 |
|
|
|
|
|
|
|
|
|
|
|
|
|
| amino acid metabolism |
FunCat |
84 |
11 |
|
|
|
|
|
|
|
|
|
|
|
|
|
| glucosinolate biosynthesis from phenylalanine |
AraCyc |
80 |
8 |
|
|
|
|
|
|
|
|
|
|
|
|
|
| Flavonoid and anthocyanin metabolism |
BioPath |
73 |
9 |
|
|
|
|
|
|
|
|
|
|
|
|
|
| glucosinolate biosynthesis |
TAIR-GO |
70 |
7 |
|
|
|
|
|
|
|
|
|
|
|
|
|
| indoleacetic acid biosynthesis |
TAIR-GO |
70 |
7 |
|
|
|
|
|
|
|
|
|
|
|
|
|
| tryptophan catabolism |
TAIR-GO |
70 |
7 |
|
|
|
|
|
|
|
|
|
|
|
|
|
| IAA biosynthesis |
AraCyc |
70 |
7 |
|
|
|
|
|
|
|
|
|
|
|
|
|
| IAA biosynthesis I |
AraCyc |
70 |
7 |
|
|
|
|
|
|
|
|
|
|
|
|
|
| Ascorbate and aldarate metabolism |
KEGG |
48 |
5 |
|
|
|
|
|
|
|
|
|
|
|
|
|
| nucleotide metabolism |
FunCat |
46 |
5 |
|
|
|
|
|
|
|
|
|
|
|
|
|
| indole glucosinolate biosynthesis |
TAIR-GO |
40 |
4 |
|
|
|
|
|
|
|
|
|
|
|
|
|
| response to red light |
TAIR-GO |
40 |
4 |
|
|
|
|
|
|
|
|
|
|
|
|
|
| shade avoidance |
TAIR-GO |
40 |
4 |
|
|
|
|
|
|
|
|
|
|
|
|
|
| Fluorene degradation |
KEGG |
40 |
4 |
|
|
|
|
|
|
|
|
|
|
|
|
|
| gamma-Hexachlorocyclohexane degradation |
KEGG |
40 |
4 |
|
|
|
|
|
|
|
|
|
|
|
|
|
|
|
|
|
|
|
|
|
|
|
|
|
|
|
|
|
|
|
|
|
|
|
|
|
|
|
|
|
|
|
|
|
|
|
| Pathways co-expressed in the Organ and Tissue data set (with more than 18 annotation points) |
|
CYP83B1, SUR2, RNT1, RED1, ATR4 (At4g31500) |
|
|
|
|
|
|
|
|
| max. difference between log2-ratios: |
6.8 |
|
|
|
|
|
|
|
|
|
|
|
|
| max. difference between log2-ratios excluding lowest and highest 5%: |
5.4 |
|
|
|
|
|
|
|
|
|
|
|
|
| Pathway |
Source |
Scores of Genes |
p[Score] |
No. of Genes |
p[genes] |
Link to organ heatmap |
|
|
|
|
|
|
|
| Glucosinolate Metabolism |
LitPath |
100 |
0.000 |
10 |
0.000 |
|
|
|
| Biosynthesis of Amino Acids and Derivatives |
BioPath |
88 |
0.000 |
11 |
0.000 |
|
|
| Glutathione metabolism |
BioPath |
68 |
0.000 |
9 |
0.000 |
|
|
| Phenylpropanoid Metabolism |
BioPath |
42 |
0.000 |
5 |
0.037 |
|
|
| glucosinolate biosynthesis |
TAIR-GO |
40 |
0.000 |
4 |
0.000 |
|
|
| Selenoamino acid metabolism |
KEGG |
40 |
0.000 |
5 |
0.000 |
|
|
| Sulfur metabolism |
KEGG |
40 |
0.000 |
5 |
0.000 |
|
|
| sulfate assimilation III |
AraCyc |
36 |
0.000 |
5 |
0.000 |
|
|
| Lipid signaling |
AcylLipid |
36 |
0.000 |
5 |
0.000 |
|
|
| tryptophan biosynthesis |
TAIR-GO |
30 |
0.000 |
3 |
0.000 |
|
|
| glucosinolate biosynthesis from tryptophan |
AraCyc |
30 |
0.000 |
3 |
0.000 |
|
|
| Phenylalanine, tyrosine and tryptophan biosynthesis |
KEGG |
30 |
0.000 |
3 |
0.001 |
|
|
| Purine metabolism |
KEGG |
30 |
0.000 |
3 |
0.003 |
|
|
| jasmonic acid biosynthesis |
TAIR-GO |
26 |
0.000 |
3 |
0.001 |
|
|
|
|
|
|
|
|
|
|
|
| jasmonic acid biosynthesis |
AraCyc |
26 |
0.000 |
3 |
0.000 |
|
|
|
|
|
|
|
|
|
|
|
| tryptophan biosynthesis |
AraCyc |
22 |
0.000 |
3 |
0.000 |
|
|
|
|
|
|
|
|
|
|
|
| Aromatic amino acid (Phe, Tyr, Trp) metabolism |
BioPath |
20 |
0.000 |
2 |
0.046 |
|
|
|
|
|
|
|
|
|
|
|
| Flavonoid and anthocyanin metabolism |
BioPath |
20 |
0.000 |
2 |
0.046 |
|
|
|
|
|
|
|
|
|
|
|
| indoleacetic acid biosynthesis |
TAIR-GO |
20 |
0.000 |
2 |
0.000 |
|
|
|
|
|
|
|
|
|
|
|
| response to wounding |
TAIR-GO |
20 |
0.000 |
2 |
0.010 |
|
|
|
|
|
|
|
|
|
|
|
| tryptophan catabolism |
TAIR-GO |
20 |
0.000 |
2 |
0.000 |
|
|
|
|
|
|
|
|
|
|
|
| cysteine biosynthesis I |
AraCyc |
20 |
0.000 |
3 |
0.002 |
|
|
|
|
|
|
|
|
|
|
|
| glucosinolate biosynthesis from homomethionine |
AraCyc |
20 |
0.000 |
2 |
0.000 |
|
|
|
|
|
|
|
|
|
|
|
| glucosinolate biosynthesis from phenylalanine |
AraCyc |
20 |
0.000 |
2 |
0.000 |
|
|
|
|
|
|
|
|
|
|
|
| IAA biosynthesis |
AraCyc |
20 |
0.000 |
2 |
0.001 |
|
|
|
|
|
|
|
|
|
|
|
| IAA biosynthesis I |
AraCyc |
20 |
0.000 |
2 |
0.000 |
|
|
|
|
|
|
|
|
|
|
|
| Shikimate pathway |
LitPath |
20 |
0.000 |
2 |
0.072 |
|
|
|
|
|
|
|
|
|
|
|
| Trp biosyntesis |
LitPath |
20 |
0.000 |
2 |
0.007 |
|
|
|
|
|
|
|
|
|
|
|
|
|
|
|
|
|
|
|
|
|
|
|
|
|
|
|
|
|
|
|
|
|
|
|
|
|
|
|
|
|
|
|
|
|
| Pathways co-expressed in the Stress data set ( with more than 10 annotation points) |
|
CYP83B1, SUR2, RNT1, RED1, ATR4 (At4g31500) |
|
|
|
|
|
|
|
|
| max. difference between log2-ratios: |
6.5 |
|
|
|
|
|
|
|
|
|
|
|
|
| max. difference between log2-ratios excluding lowest and highest 5%: |
3.4 |
|
|
|
|
|
|
|
|
|
|
|
|
| Pathway |
Source |
Scores of Genes |
p[Score] |
No. of Genes |
p[genes] |
Link to stress heatmap |
|
|
|
|
|
|
|
| Glucosinolate Metabolism |
LitPath |
70 |
0.000 |
7 |
0.000 |
|
| Phenylpropanoid Metabolism |
BioPath |
70 |
0.000 |
7 |
0.000 |
| tryptophan biosynthesis |
TAIR-GO |
50 |
0.000 |
5 |
0.000 |
| Biosynthesis of Amino Acids and Derivatives |
BioPath |
44 |
0.000 |
6 |
0.001 |
| Glutathione metabolism |
BioPath |
44 |
0.000 |
6 |
0.000 |
| Aromatic amino acid (Phe, Tyr, Trp) metabolism |
BioPath |
40 |
0.000 |
4 |
0.000 |
| Phenylalanine, tyrosine and tryptophan biosynthesis |
KEGG |
40 |
0.000 |
4 |
0.000 |
| Shikimate pathway |
LitPath |
40 |
0.000 |
4 |
0.002 |
|
|
|
|
|
|
|
|
|
|
|
| Trp biosyntesis |
LitPath |
40 |
0.000 |
4 |
0.000 |
|
|
|
|
|
|
|
|
|
|
|
| Sulfur metabolism |
KEGG |
39 |
0.000 |
4 |
0.000 |
|
|
|
|
|
|
|
|
|
|
|
| tryptophan biosynthesis |
AraCyc |
32 |
0.000 |
4 |
0.000 |
|
|
|
|
|
|
|
|
|
|
|
| glucosinolate biosynthesis from tryptophan |
AraCyc |
30 |
0.000 |
3 |
0.000 |
|
|
|
|
|
|
|
|
|
|
|
| Selenoamino acid metabolism |
KEGG |
30 |
0.000 |
3 |
0.000 |
|
|
|
|
|
|
|
|
|
|
|
| Stilbene, coumarine and lignin biosynthesis |
KEGG |
30 |
0.000 |
3 |
0.008 |
|
|
|
|
|
|
|
|
|
|
|
| Flavonoid and anthocyanin metabolism |
BioPath |
20 |
0.000 |
2 |
0.016 |
|
|
|
|
|
|
|
|
|
|
|
| indoleacetic acid biosynthesis |
TAIR-GO |
20 |
0.000 |
2 |
0.000 |
|
|
|
|
|
|
|
|
|
|
|
| response to wounding |
TAIR-GO |
20 |
0.000 |
2 |
0.004 |
|
|
|
|
|
|
|
|
|
|
|
| tryptophan catabolism |
TAIR-GO |
20 |
0.000 |
2 |
0.000 |
|
|
|
|
|
|
|
|
|
|
|
| cysteine biosynthesis I |
AraCyc |
20 |
0.000 |
2 |
0.003 |
|
|
|
|
|
|
|
|
|
|
|
| glucosinolate biosynthesis from phenylalanine |
AraCyc |
20 |
0.000 |
2 |
0.000 |
|
|
|
|
|
|
|
|
|
|
|
| IAA biosynthesis |
AraCyc |
20 |
0.000 |
2 |
0.000 |
|
|
|
|
|
|
|
|
|
|
|
| IAA biosynthesis I |
AraCyc |
20 |
0.000 |
2 |
0.000 |
|
|
|
|
|
|
|
|
|
|
|
| lignin biosynthesis |
AraCyc |
20 |
0.000 |
2 |
0.005 |
|
|
|
|
|
|
|
|
|
|
|
| sulfate assimilation III |
AraCyc |
20 |
0.000 |
2 |
0.002 |
|
|
|
|
|
|
|
|
|
|
|
| amino acid metabolism |
FunCat |
20 |
0.000 |
2 |
0.001 |
|
|
|
|
|
|
|
|
|
|
|
| Purine metabolism |
KEGG |
20 |
0.000 |
2 |
0.013 |
|
|
|
|
|
|
|
|
|
|
|
|
|
|
|
|
|
|
|
|
|
|
|
|
|
|
|
|
|
|
|
|
|
|
|
|
|
|
|
|
|
|
|
|
|
| Pathways co-expressed in the Hormone etc. data set (with more than 20 annotation points) |
|
CYP83B1, SUR2, RNT1, RED1, ATR4 (At4g31500) |
|
|
|
|
|
|
|
|
| max. difference between log2-ratios: |
6.2 |
|
|
|
|
|
|
|
|
|
|
|
|
| max. difference between log2-ratios excluding lowest and highest 5%: |
2.3 |
|
|
|
|
|
|
|
|
|
|
|
|
| Pathway |
Source |
Scores of Genes |
p[Score] |
No. of Genes |
p[genes] |
Link to hormones etc. heatmap |
|
|
|
|
|
|
|
| Biosynthesis of Amino Acids and Derivatives |
BioPath |
84 |
0.000 |
13 |
0.002 |

|
|
|
|
|
|
| Phenylpropanoid Metabolism |
BioPath |
61 |
0.000 |
10 |
0.038 |
|
|
|
|
|
| Glucosinolate Metabolism |
LitPath |
60 |
0.000 |
6 |
0.000 |
|
|
|
|
|
| Glutathione metabolism |
BioPath |
48 |
0.000 |
8 |
0.001 |
|
|
|
|
|
| amino acid metabolism |
FunCat |
44 |
0.000 |
6 |
0.020 |
|
|
|
|
|
| Phenylalanine, tyrosine and tryptophan biosynthesis |
KEGG |
42 |
0.000 |
5 |
0.003 |
|
|
|
|
|
| colanic acid building blocks biosynthesis |
AraCyc |
40 |
0.000 |
7 |
0.002 |
|
|
|
|
|
| Sulfur metabolism |
KEGG |
39 |
0.000 |
4 |
0.001 |
|
|
|
|
|
| glycolysis and gluconeogenesis |
FunCat |
38.5 |
0.000 |
6 |
0.037 |
|
|
|
|
|
| Aromatic amino acid (Phe, Tyr, Trp) metabolism |
BioPath |
36 |
0.000 |
5 |
0.012 |
|
|
|
|
|
| C-compound and carbohydrate utilization |
FunCat |
36 |
0.000 |
5 |
0.000 |
|
|
|
|
|
| Selenoamino acid metabolism |
KEGG |
34 |
0.000 |
4 |
0.003 |
|
|
|
|
|
| Shikimate pathway |
LitPath |
34 |
0.000 |
4 |
0.014 |
|
|
|
|
|
|
|
|
|
|
|
| Folding, Sorting and Degradation |
KEGG |
31 |
0.031 |
5 |
0.158 |
|
|
|
|
|
|
|
|
|
|
|
| Gluconeogenesis from lipids in seeds |
BioPath |
30 |
0.000 |
5 |
0.032 |
|
|
|
|
|
|
|
|
|
|
|
| tryptophan biosynthesis |
TAIR-GO |
30 |
0.000 |
3 |
0.004 |
|
|
|
|
|
|
|
|
|
|
|
| glycerol degradation II |
AraCyc |
28 |
0.000 |
4 |
0.036 |
|
|
|
|
|
|
|
|
|
|
|
| sulfate assimilation III |
AraCyc |
26 |
0.000 |
4 |
0.010 |
|
|
|
|
|
|
|
|
|
|
|
| Glutamate metabolism |
KEGG |
26 |
0.000 |
3 |
0.058 |
|
|
|
|
|
|
|
|
|
|
|
| alanine biosynthesis II |
AraCyc |
24 |
0.000 |
3 |
0.018 |
|
|
|
|
|
|
|
|
|
|
|
| galactose degradation I |
AraCyc |
24 |
0.000 |
5 |
0.000 |
|
|
|
|
|
|
|
|
|
|
|
| lactose degradation IV |
AraCyc |
24 |
0.000 |
5 |
0.000 |
|
|
|
|
|
|
|
|
|
|
|
| phenylalanine biosynthesis II |
AraCyc |
24 |
0.000 |
3 |
0.011 |
|
|
|
|
|
|
|
|
|
|
|
| Purine metabolism |
KEGG |
24 |
0.002 |
3 |
0.147 |
|
|
|
|
|
|
|
|
|
|
|
| Flavonoid and anthocyanin metabolism |
BioPath |
23 |
0.000 |
4 |
0.043 |
|
|
|
|
|
|
|
|
|
|
|
| GDP-D-rhamnose biosynthesis |
AraCyc |
22 |
0.000 |
3 |
0.001 |
|
|
|
|
|
|
|
|
|
|
|
| tryptophan biosynthesis |
AraCyc |
22 |
0.000 |
3 |
0.020 |
|
|
|
|
|
|
|
|
|
|
|
| assimilation of ammonia, metabolism of the glutamate group |
FunCat |
22 |
0.000 |
3 |
0.002 |
|
|
|
|
|
|
|
|
|
|
|
| dTDP-rhamnose biosynthesis |
AraCyc |
21 |
0.000 |
3 |
0.098 |
|
|
|
|
|
|
|
|
|
|
|
|
|
|
|
|
|
|
|
|
|
|
|
|
|
|
|
|
|
|
|
|
|
|
|
|
|
|
|
|
|
|
|
|
|
|
|
|
|
|
|
|
|
|
|
|
|
|
|
|
|
|
| Pathways co-expressed in the Mutant data set (with more than 10 annotation points) |
|
CYP83B1, SUR2, RNT1, RED1, ATR4 (At4g31500) |
|
|
|
|
|
|
|
|
| max. difference between log2-ratios: |
5.9 |
|
|
|
|
|
|
|
|
|
|
|
|
| max. difference between log2-ratios excluding lowest and highest 5%: |
2.6 |
|
|
|
|
|
|
|
|
|
|
|
|
| Pathway |
Source |
Scores of Genes |
p[Score] |
No. of Genes |
p[genes] |
Link to mutants heatmap |
|
|
|
|
|
|
|
| Glucosinolate Metabolism |
LitPath |
50 |
0.000 |
5 |
0.000 |
|
|
|
|
| Phenylpropanoid Metabolism |
BioPath |
40 |
0.000 |
4 |
0.005 |
|
|
|
| tryptophan biosynthesis |
TAIR-GO |
40 |
0.000 |
4 |
0.000 |
|
|
|
| Aromatic amino acid (Phe, Tyr, Trp) metabolism |
BioPath |
30 |
0.000 |
3 |
0.000 |
|
|
|
| glucosinolate biosynthesis from tryptophan |
AraCyc |
30 |
0.000 |
3 |
0.000 |
|
|
|
| Shikimate pathway |
LitPath |
30 |
0.000 |
3 |
0.007 |
|
|
|
|
|
|
|
|
|
|
|
| Trp biosyntesis |
LitPath |
30 |
0.000 |
3 |
0.000 |
|
|
|
|
|
|
|
|
|
|
|
| Biosynthesis of Amino Acids and Derivatives |
BioPath |
26 |
0.000 |
3 |
0.023 |
|
|
|
|
|
|
|
|
|
|
|
| Glutathione metabolism |
BioPath |
26 |
0.000 |
3 |
0.001 |
|
|
|
|
|
|
|
|
|
|
|
| tryptophan biosynthesis |
AraCyc |
22 |
0.000 |
3 |
0.000 |
|
|
|
|
|
|
|
|
|
|
|
| tryptophan catabolism |
TAIR-GO |
20 |
0.000 |
2 |
0.000 |
|
|
|
|
|
|
|
|
|
|
|
| glucosinolate biosynthesis from phenylalanine |
AraCyc |
20 |
0.000 |
2 |
0.000 |
|
|
|
|
|
|
|
|
|
|
|
| IAA biosynthesis |
AraCyc |
20 |
0.000 |
2 |
0.000 |
|
|
|
|
|
|
|
|
|
|
|
| IAA biosynthesis I |
AraCyc |
20 |
0.000 |
2 |
0.000 |
|
|
|
|
|
|
|
|
|
|
|
| Phenylalanine, tyrosine and tryptophan biosynthesis |
KEGG |
20 |
0.000 |
2 |
0.000 |
|
|
|
|
|
|
|
|
|
|
|
|
|
|
|
|
|
|
|
|
|
|
|
|
|
|
|
|