|
|
|
|
|
|
|
|
|
|
|
|
|
|
|
|
|
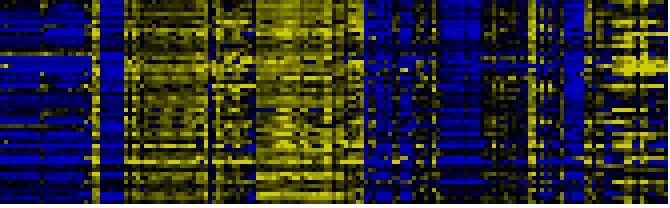
| Pathways co-expressed in the Organ and Tissue data set (with more than 6 annotation points) |
|
CYP94D2 (At3g56630) |
|
|
|
|
|
|
|
|
| max. difference between log2-ratios: |
4.7 |
|
|
|
|
|
|
|
|
|
|
|
|
| max. difference between log2-ratios excluding lowest and highest 5%: |
3.5 |
|
|
|
|
|
|
|
|
|
|
|
|
| Pathway |
Source |
Scores of Genes |
p[Score] |
No. of Genes |
p[genes] |
Link to organ heatmap |
|
|
|
|
|
|
|
| Plastidial Isoprenoids (Chlorophylls, Carotenoids, Tocopherols, Plastoquinone, Phylloquinone) |
BioPath |
60 |
0.000 |
8 |
0.000 |
|
|
|
| Carotenoid and abscisic acid metabolism |
LitPath |
39 |
0.000 |
6 |
0.000 |
|
|
| Carotenoid biosynthesis |
BioPath |
28 |
0.000 |
3 |
0.000 |
|
|
| carotenoid biosynthesis |
AraCyc |
28 |
0.000 |
3 |
0.000 |
|
|
| carotenid biosynthesis |
LitPath |
28 |
0.000 |
3 |
0.000 |
|
|
| Biosynthesis of prenyl diphosphates |
BioPath |
20 |
0.000 |
3 |
0.004 |
|
|
| Folding, Sorting and Degradation |
KEGG |
19 |
0.000 |
2 |
0.065 |
|
|
| Glutathione metabolism |
KEGG |
19 |
0.000 |
2 |
0.006 |
|
|
| biogenesis of chloroplast |
FunCat |
18 |
0.000 |
3 |
0.004 |
|
|
| C-compound and carbohydrate metabolism |
FunCat |
18 |
0.037 |
5 |
0.062 |
|
|
| degradation |
FunCat |
17 |
0.000 |
3 |
0.000 |
|
|
| protein degradation |
FunCat |
17 |
0.000 |
3 |
0.000 |
|
|
| Aromatic amino acid (Phe, Tyr, Trp) metabolism |
BioPath |
16 |
0.000 |
2 |
0.046 |
|
|
| Phenylalanine, tyrosine and tryptophan biosynthesis |
KEGG |
16 |
0.000 |
2 |
0.006 |
|
|
|
|
|
|
|
|
|
|
|
| Shikimate pathway |
LitPath |
16 |
0.017 |
2 |
0.193 |
|
|
|
|
|
|
|
|
|
|
|
| Biosynthesis of steroids |
KEGG |
14 |
0.000 |
2 |
0.007 |
|
|
|
|
|
|
|
|
|
|
|
| amino acid metabolism |
FunCat |
12 |
0.014 |
2 |
0.100 |
|
|
|
|
|
|
|
|
|
|
|
| Chlorophyll biosynthesis and breakdown |
BioPath |
10 |
0.004 |
1 |
0.084 |
|
|
|
|
|
|
|
|
|
|
|
| Delta-pH pathway |
BioPath |
10 |
0.000 |
1 |
0.001 |
|
|
|
|
|
|
|
|
|
|
|
| Pathway for nuclear-encoded, thylakoid-localized proteins |
BioPath |
10 |
0.000 |
1 |
0.015 |
|
|
|
|
|
|
|
|
|
|
|
| aromatic amino acid family biosynthesis |
TAIR-GO |
10 |
0.000 |
1 |
0.015 |
|
|
|
|
|
|
|
|
|
|
|
| aromatic amino acid family biosynthesis, shikimate pathway |
TAIR-GO |
10 |
0.000 |
1 |
0.011 |
|
|
|
|
|
|
|
|
|
|
|
| carotene metabolism |
TAIR-GO |
10 |
0.000 |
1 |
0.000 |
|
|
|
|
|
|
|
|
|
|
|
| chlorophyll catabolism |
TAIR-GO |
10 |
0.000 |
1 |
0.001 |
|
|
|
|
|
|
|
|
|
|
|
| hypersensitive response |
TAIR-GO |
10 |
0.000 |
1 |
0.003 |
|
|
|
|
|
|
|
|
|
|
|
| lipoic acid metabolism |
TAIR-GO |
10 |
0.000 |
1 |
0.000 |
|
|
|
|
|
|
|
|
|
|
|
| photosystem I |
TAIR-GO |
10 |
0.000 |
1 |
0.004 |
|
|
|
|
|
|
|
|
|
|
|
| photosystem II |
TAIR-GO |
10 |
0.000 |
1 |
0.002 |
|
|
|
|
|
|
|
|
|
|
|
| photosystem II (sensu Viridiplantae) |
TAIR-GO |
10 |
0.000 |
1 |
0.001 |
|
|
|
|
|
|
|
|
|
|
|
| thylakoid membrane organization and biogenesis |
TAIR-GO |
10 |
0.000 |
1 |
0.000 |
|
|
|
|
|
|
|
|
|
|
|
| xanthophyll cycle |
TAIR-GO |
10 |
0.000 |
1 |
0.000 |
|
|
|
|
|
|
|
|
|
|
|
| xanthophyll metabolism |
TAIR-GO |
10 |
0.000 |
1 |
0.000 |
|
|
|
|
|
|
|
|
|
|
|
| phenylalanine degradation I |
AraCyc |
10 |
0.000 |
2 |
0.011 |
|
|
|
|
|
|
|
|
|
|
|
| photorespiration |
AraCyc |
10 |
0.000 |
4 |
0.000 |
|
|
|
|
|
|
|
|
|
|
|
| TCA cycle -- aerobic respiration |
AraCyc |
10 |
0.000 |
2 |
0.048 |
|
|
|
|
|
|
|
|
|
|
|
| TCA cycle variation IV |
AraCyc |
10 |
0.000 |
2 |
0.043 |
|
|
|
|
|
|
|
|
|
|
|
| TCA cycle variation VII |
AraCyc |
10 |
0.014 |
2 |
0.123 |
|
|
|
|
|
|
|
|
|
|
|
| TCA cycle variation VIII |
AraCyc |
10 |
0.001 |
2 |
0.054 |
|
|
|
|
|
|
|
|
|
|
|
| xanthophyll cycle |
AraCyc |
10 |
0.000 |
1 |
0.000 |
|
|
|
|
|
|
|
|
|
|
|
| Carbon fixation |
KEGG |
10 |
0.000 |
2 |
0.018 |
|
|
|
|
|
|
|
|
|
|
|
| Protein export |
KEGG |
10 |
0.000 |
1 |
0.026 |
|
|
|
|
|
|
|
|
|
|
|
| metabolism of acyl-lipids in mitochondria |
AcylLipid |
10 |
0.000 |
1 |
0.006 |
|
|
|
|
|
|
|
|
|
|
|
| abscisic acid biosynthesis |
LitPath |
10 |
0.000 |
2 |
0.002 |
|
|
|
|
|
|
|
|
|
|
|
| chlorophyll catabolism |
LitPath |
10 |
0.000 |
1 |
0.004 |
|
|
|
|
|
|
|
|
|
|
|
| chorismate biosynthesis |
LitPath |
10 |
0.001 |
1 |
0.097 |
|
|
|
|
|
|
|
|
|
|
|
| IPP (isopentenyl diphosphate) and DMAPP (dimethylallyl diphosphat) biosynthesis |
LitPath |
10 |
0.025 |
2 |
0.037 |
|
|
|
|
|
|
|
|
|
|
|
| MEP (methylerythritol P) pathway, plastids |
LitPath |
10 |
0.000 |
2 |
0.004 |
|
|
|
|
|
|
|
|
|
|
|
| polyprenyl diphosphate biosynthesis |
LitPath |
10 |
0.000 |
1 |
0.034 |
|
|
|
|
|
|
|
|
|
|
|
| Protein folding and associated processing |
KEGG |
9 |
0.000 |
1 |
0.021 |
|
|
|
|
|
|
|
|
|
|
|
| Chloroplastic protein turnover |
BioPath |
8 |
0.000 |
2 |
0.001 |
|
|
|
|
|
|
|
|
|
|
|
| ClpP protease complex |
BioPath |
8 |
0.000 |
2 |
0.000 |
|
|
|
|
|
|
|
|
|
|
|
|
|
|
|
|
|
|
|
|
|
|
|
|
|
|
|
|
|
|
|
|
|
|
|
|
|
|
|
|
|
|
|
|
|
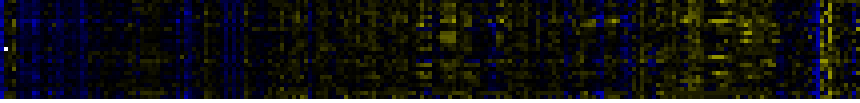
| Pathways co-expressed in the Stress data set ( with more than 6 annotation points) |
|
CYP94D2 (At3g56630) |
|
|
|
|
|
|
|
|
| max. difference between log2-ratios: |
3.7 |
|
|
|
|
|
|
|
|
|
|
|
|
| max. difference between log2-ratios excluding lowest and highest 5%: |
1.5 |
|
|
|
|
|
|
|
|
|
|
|
|
| Pathway |
Source |
Scores of Genes |
p[Score] |
No. of Genes |
p[genes] |
Link to stress heatmap |
|
|
|
|
|
|
|
| transport |
FunCat |
19 |
0.000 |
2 |
0.000 |
|
| Transcription (chloroplast) |
BioPath |
18 |
0.000 |
2 |
0.000 |
| transcription initiation |
TAIR-GO |
18 |
0.000 |
2 |
0.000 |
| Folding, Sorting and Degradation |
KEGG |
17 |
0.000 |
3 |
0.000 |
| Chloroplastic protein import via envelope membrane |
BioPath |
13 |
0.000 |
2 |
0.000 |
| Chloroplastic protein turnover |
BioPath |
10 |
0.000 |
1 |
0.002 |
| FtsH protease (many homologues / subcellular localization ambiguous) |
BioPath |
10 |
0.000 |
1 |
0.000 |
| Thylakoid biogenesis and photosystem assembly |
BioPath |
10 |
0.000 |
1 |
0.001 |
|
|
|
|
|
|
|
|
|
|
|
| cytochrome b6f complex |
TAIR-GO |
10 |
0.000 |
1 |
0.000 |
|
|
|
|
|
|
|
|
|
|
|
| cytochrome b6f complex assembly |
TAIR-GO |
10 |
0.000 |
1 |
0.000 |
|
|
|
|
|
|
|
|
|
|
|
| photosynthesis |
TAIR-GO |
10 |
0.000 |
1 |
0.005 |
|
|
|
|
|
|
|
|
|
|
|
| photosynthesis, dark reaction |
TAIR-GO |
10 |
0.000 |
1 |
0.000 |
|
|
|
|
|
|
|
|
|
|
|
| electron transport and membrane-associated energy conservation |
FunCat |
10 |
0.000 |
1 |
0.001 |
|
|
|
|
|
|
|
|
|
|
|
| energy |
FunCat |
10 |
0.000 |
1 |
0.000 |
|
|
|
|
|
|
|
|
|
|
|
| mRNA synthesis |
FunCat |
10 |
0.000 |
1 |
0.008 |
|
|
|
|
|
|
|
|
|
|
|
| RNA synthesis |
FunCat |
10 |
0.000 |
1 |
0.008 |
|
|
|
|
|
|
|
|
|
|
|
| transcription |
FunCat |
10 |
0.000 |
1 |
0.002 |
|
|
|
|
|
|
|
|
|
|
|
| transcriptional control |
FunCat |
10 |
0.000 |
1 |
0.002 |
|
|
|
|
|
|
|
|
|
|
|
| RNA polymerase |
KEGG |
10 |
0.000 |
1 |
0.005 |
|
|
|
|
|
|
|
|
|
|
|
| Transcription |
KEGG |
10 |
0.000 |
1 |
0.019 |
|
|
|
|
|
|
|
|
|
|
|
| Toc apparatus |
BioPath |
9 |
0.000 |
1 |
0.002 |
|
|
|
|
|
|
|
|
|
|
|
| protein-chloroplast targeting |
TAIR-GO |
9 |
0.000 |
1 |
0.000 |
|
|
|
|
|
|
|
|
|
|
|
| chloroplast transport |
FunCat |
9 |
0.000 |
1 |
0.001 |
|
|
|
|
|
|
|
|
|
|
|
| degradation |
FunCat |
9 |
0.000 |
1 |
0.007 |
|
|
|
|
|
|
|
|
|
|
|
| protein degradation |
FunCat |
9 |
0.000 |
1 |
0.004 |
|
|
|
|
|
|
|
|
|
|
|
| protein targeting, sorting and translocation |
FunCat |
9 |
0.000 |
1 |
0.001 |
|
|
|
|
|
|
|
|
|
|
|
| transport routes |
FunCat |
9 |
0.000 |
1 |
0.004 |
|
|
|
|
|
|
|
|
|
|
|
| Protein folding and associated processing |
KEGG |
9 |
0.000 |
1 |
0.002 |
|
|
|
|
|
|
|
|
|
|
|
| additional photosystem II components |
BioPath |
8 |
0.000 |
1 |
0.022 |
|
|
|
|
|
|
|
|
|
|
|
| Early light-inducible proteins |
BioPath |
8 |
0.000 |
1 |
0.001 |
|
|
|
|
|
|
|
|
|
|
|
| Protein export |
KEGG |
8 |
0.000 |
2 |
0.000 |
|
|
|
|
|
|
|
|
|
|
|
|
|
|
|
|
|
|
|
|
|
|
|
|
|
|
|
|
|
|
|
|
|
|
|
|
|
|
|
|
|
|
|
|
|
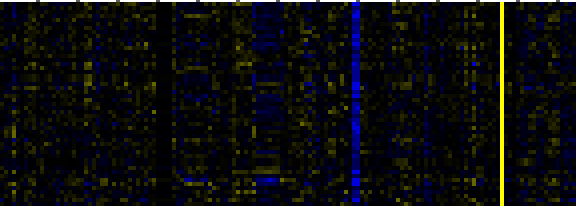
| Pathways co-expressed in the Hormone etc. data set (with more than 6 annotation points) |
|
CYP94D2 (At3g56630) |
|
|
|
|
|
|
|
|
| max. difference between log2-ratios: |
2.8 |
|
|
|
|
|
|
|
|
|
|
|
|
| max. difference between log2-ratios excluding lowest and highest 5%: |
0.9 |
|
|
|
|
|
|
|
|
|
|
|
|
| Pathway |
Source |
Scores of Genes |
p[Score] |
No. of Genes |
p[genes] |
Link to hormones etc. heatmap |
|
|
|
|
|
|
|
| proteasome regulatory particle, base subcomplex (sensu Eukaryota) |
TAIR-GO |
14 |
0.000 |
2 |
0.000 |

|
|
|
|
|
|
| protein catabolism |
TAIR-GO |
14 |
0.000 |
2 |
0.000 |
|
|
|
|
|
| ubiquitin-dependent protein catabolism |
TAIR-GO |
14 |
0.000 |
2 |
0.000 |
|
|
|
|
|
| Folding, Sorting and Degradation |
KEGG |
14 |
0.000 |
2 |
0.001 |
|
|
|
|
|
|
|
|
|
|
|
| Proteasome |
KEGG |
14 |
0.000 |
2 |
0.000 |
|
|
|
|
|
|
|
|
|
|
|
| Carotenoid biosynthesis |
BioPath |
10 |
0.000 |
1 |
0.000 |
|
|
|
|
|
|
|
|
|
|
|
| Plastidial Isoprenoids (Chlorophylls, Carotenoids, Tocopherols, Plastoquinone, Phylloquinone) |
BioPath |
10 |
0.000 |
1 |
0.018 |
|
|
|
|
|
|
|
|
|
|
|
| carotene metabolism |
TAIR-GO |
10 |
0.000 |
1 |
0.000 |
|
|
|
|
|
|
|
|
|
|
|
| carotenoid biosynthesis |
AraCyc |
10 |
0.000 |
1 |
0.000 |
|
|
|
|
|
|
|
|
|
|
|
| biosynthesis of derivatives of homoisopentenyl pyrophosphate |
FunCat |
10 |
0.000 |
1 |
0.000 |
|
|
|
|
|
|
|
|
|
|
|
| carotenid biosynthesis |
LitPath |
10 |
0.000 |
1 |
0.001 |
|
|
|
|
|
|
|
|
|
|
|
| Carotenoid and abscisic acid metabolism |
LitPath |
10 |
0.000 |
1 |
0.005 |
|
|
|
|
|
|
|
|
|
|
|
| additional photosystem II components |
BioPath |
8 |
0.000 |
1 |
0.004 |
|
|
|
|
|
|
|
|
|
|
|
| Early light-inducible proteins |
BioPath |
8 |
0.000 |
1 |
0.000 |
|
|
|
|
|
|
|
|
|
|
|
| Photosystems |
BioPath |
8 |
0.000 |
1 |
0.029 |
|
|
|
|
|
|
|
|
|
|
|
|
|
|
|
|
|
|
|
|
|
|
|
|
|
|
|
|
|
|
|
|
|
|
|
|
|
|
|
|
|
|
|
|
|
|
|
|
|
|
|
|
|
|
|
|
|
|
|
|
|
|
| Pathways co-expressed in the Mutant data set (with more than 30 annotation points) |
|
CYP94D2 (At3g56630) |
|
|
|
|
|
|
|
|
| max. difference between log2-ratios: |
8.2 |
|
|
|
|
|
|
|
|
|
|
|
|
| max. difference between log2-ratios excluding lowest and highest 5%: |
1.4 |
|
|
|
|
|
|
|
|
|
|
|
|
| Pathway |
Source |
Scores of Genes |
p[Score] |
No. of Genes |
p[genes] |
Link to mutants heatmap |
|
|
|
|
|
|
|
| C-compound and carbohydrate metabolism |
FunCat |
176 |
0.000 |
33 |
0.052 |
|
|
|
|
| Biosynthesis of Amino Acids and Derivatives |
BioPath |
146 |
0.007 |
19 |
0.307 |
|
|
|
| Plastidial Isoprenoids (Chlorophylls, Carotenoids, Tocopherols, Plastoquinone, Phylloquinone) |
BioPath |
143 |
0.000 |
18 |
0.001 |
|
|
|
| transport |
FunCat |
111 |
0.000 |
20 |
0.000 |
|
|
|
| Pyruvate metabolism |
KEGG |
94 |
0.000 |
14 |
0.031 |
|
|
|
| Oxidative phosphorylation |
KEGG |
85 |
0.000 |
21 |
0.000 |
|
|
|
| transport facilitation |
FunCat |
69 |
0.000 |
12 |
0.000 |
|
|
|
| development |
TAIR-GO |
59 |
0.000 |
7 |
0.082 |
|
|
|
| Sulfur metabolism |
KEGG |
59 |
0.000 |
8 |
0.001 |
|
|
|
| Selenoamino acid metabolism |
KEGG |
58 |
0.000 |
7 |
0.028 |
|
|
|
| Methionin/SAM/ethylene metabolism from cysteine and aspartate |
BioPath |
56 |
0.000 |
6 |
0.034 |
|
|
|
| biogenesis of chloroplast |
FunCat |
56 |
0.006 |
11 |
0.014 |
|
|
|
| Carotenoid and abscisic acid metabolism |
LitPath |
55 |
0.000 |
8 |
0.000 |
|
|
|
| Valine, leucine and isoleucine degradation |
KEGG |
53 |
0.000 |
8 |
0.025 |
|
|
|
|
|
|
|
|
|
|
|
| Cysteine metabolism |
KEGG |
51 |
0.000 |
7 |
0.015 |
|
|
|
|
|
|
|
|
|
|
|
| Glycine, serine and threonine metabolism |
KEGG |
47 |
0.000 |
8 |
0.030 |
|
|
|
|
|
|
|
|
|
|
|
| leucine degradation I |
AraCyc |
46 |
0.000 |
6 |
0.008 |
|
|
|
|
|
|
|
|
|
|
|
| leucine degradation II |
AraCyc |
46 |
0.000 |
6 |
0.000 |
|
|
|
|
|
|
|
|
|
|
|
| Citrate cycle (TCA cycle) |
KEGG |
46 |
0.004 |
7 |
0.134 |
|
|
|
|
|
|
|
|
|
|
|
| Carotenoid biosynthesis |
BioPath |
44 |
0.000 |
5 |
0.000 |
|
|
|
|
|
|
|
|
|
|
|
| carotenoid biosynthesis |
AraCyc |
44 |
0.000 |
5 |
0.000 |
|
|
|
|
|
|
|
|
|
|
|
| sulfate assimilation III |
AraCyc |
44 |
0.000 |
6 |
0.043 |
|
|
|
|
|
|
|
|
|
|
|
| carotenid biosynthesis |
LitPath |
44 |
0.000 |
5 |
0.000 |
|
|
|
|
|
|
|
|
|
|
|
| Ascorbate and aldarate metabolism |
KEGG |
43 |
0.000 |
6 |
0.030 |
|
|
|
|
|
|
|
|
|
|
|
| metabolism of acyl-lipids in mitochondria |
AcylLipid |
43 |
0.000 |
5 |
0.017 |
|
|
|
|
|
|
|
|
|
|
|
| TCA cycle -- aerobic respiration |
AraCyc |
42 |
0.000 |
8 |
0.042 |
|
|
|
|
|
|
|
|
|
|
|
| TCA cycle variation VIII |
AraCyc |
42 |
0.001 |
8 |
0.053 |
|
|
|
|
|
|
|
|
|
|
|
| chlorophyll biosynthesis |
TAIR-GO |
40 |
0.000 |
4 |
0.026 |
|
|
|
|
|
|
|
|
|
|
|
| photorespiration |
AraCyc |
40 |
0.000 |
7 |
0.017 |
|
|
|
|
|
|
|
|
|
|
|
| Methionine metabolism |
KEGG |
40 |
0.000 |
4 |
0.096 |
|
|
|
|
|
|
|
|
|
|
|
| chlorophyll and phytochromobilin metabolism |
LitPath |
40 |
0.030 |
4 |
0.306 |
|
|
|
|
|
|
|
|
|
|
|
| Synthesis of membrane lipids in endomembrane system |
AcylLipid |
39 |
0.007 |
6 |
0.147 |
|
|
|
|
|
|
|
|
|
|
|
| ATP-dependent proteolysis |
TAIR-GO |
38 |
0.000 |
8 |
0.000 |
|
|
|
|
|
|
|
|
|
|
|
| Synthesis of fatty acids in plastids |
AcylLipid |
38 |
0.001 |
6 |
0.056 |
|
|
|
|
|
|
|
|
|
|
|
| sterol biosynthesis |
BioPath |
36 |
0.007 |
4 |
0.135 |
|
|
|
|
|
|
|
|
|
|
|
| transported compounds (substrates) |
FunCat |
35 |
0.000 |
5 |
0.000 |
|
|
|
|
|
|
|
|
|
|
|
| Protein folding and associated processing |
KEGG |
35 |
0.000 |
6 |
0.037 |
|
|
|
|
|
|
|
|
|
|
|
| Chloroplastic protein turnover |
BioPath |
34 |
0.000 |
7 |
0.000 |
|
|
|
|
|
|
|
|
|
|
|
| Protein folding / chaperonins (chloroplast) |
BioPath |
34 |
0.000 |
5 |
0.002 |
|
|
|
|
|
|
|
|
|
|
|
| leucine biosynthesis |
AraCyc |
34 |
0.000 |
6 |
0.001 |
|
|
|
|
|
|
|
|
|
|
|
| serine-isocitrate lyase pathway |
AraCyc |
34 |
0.022 |
6 |
0.163 |
|
|
|
|
|
|
|
|
|
|
|
| Propanoate metabolism |
KEGG |
34 |
0.005 |
5 |
0.166 |
|
|
|
|
|
|
|
|
|
|
|
| Bile acid biosynthesis |
KEGG |
33 |
0.000 |
5 |
0.010 |
|
|
|
|
|
|
|
|
|
|
|
| Tryptophan metabolism |
KEGG |
33 |
0.004 |
6 |
0.126 |
|
|
|
|
|
|
|
|
|
|
|
| ascorbic acid biosynthesis |
BioPath |
32 |
0.000 |
4 |
0.064 |
|
|
|
|
|
|
|
|
|
|
|
| growth |
TAIR-GO |
32 |
0.024 |
4 |
0.188 |
|
|
|
|
|
|
|
|
|
|
|
| electron transport |
TAIR-GO |
31 |
0.001 |
5 |
0.035 |
|
|
|
|
|
|
|
|
|
|
|
| threonine degradation |
AraCyc |
31 |
0.000 |
9 |
0.000 |
|
|
|
|
|
|
|
|
|
|
|
| stress response |
FunCat |
31 |
0.000 |
4 |
0.000 |
|
|
|
|
|
|
|
|
|
|
|
|
|
|
|
|
|
|
|
|
|
|
|
|
|
|
|
|
|
|
|
|
|
|
|
|
|
|
|
|
|
|
|
|
|
