|
|
|
|
|
|
|
|
|
|
|
|
|
|
|
|
|
| Pathways co-expressed in all four data set |
|
|
|
|
|
|
|
|
|
|
|
|
|
|
|
|
| Pathway |
Source |
Sum of scores |
Sum of genes |
|
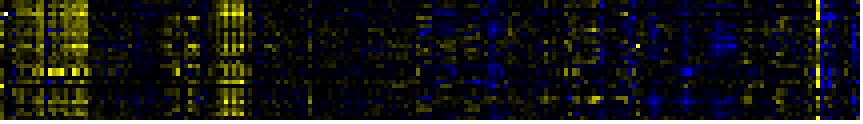
Find below a list of pathways that are co-expressed with the bait. First a list of pathways is given that are co-expressed in all four data sets. Data for each individual list are shown underneath. To the right of each table a thumbnail of the actual co-expression heatmap is given. Klick on the link to see the heatmap containing all co-expressed genes. |
|
|
|
|
|
|
|
|
|
| lignin biosynthesis |
AraCyc |
514 |
55 |
|
|
|
|
|
|
|
|
|
|
| lignin biosynthesis |
TAIR-GO |
494 |
53 |
|
|
|
|
|
|
|
|
|
|
| Phenylpropanoid pathway |
LitPath |
274 |
29 |
|
|
|
|
|
|
|
|
|
|
| Phenylpropanoid Metabolism |
BioPath |
264 |
31 |
|
|
|
|
|
|
|
|
|
|
| core phenylpropanoid metabolism |
BioPath |
220 |
22 |
|
For more information on how these pathway maps were generated please read the methods page |
|
|
|
|
|
|
|
|
|
| phenylpropanoid metabolism |
TAIR-GO |
220 |
22 |
|
|
|
|
|
|
|
|
|
|
| Stilbene, coumarine and lignin biosynthesis |
KEGG |
184 |
22 |
|

|
|
|
|
|
|
|
|
|
|
|
| suberin biosynthesis |
AraCyc |
160 |
16 |
|
|
|
|
|
|
|
|
|
|
|
| phenylpropanoid biosynthesis |
TAIR-GO |
160 |
16 |
|
|
|
|
|
|
|
|
|
|
|
| phenylpropanoid biosynthesis |
AraCyc |
150 |
15 |
|
|
|
|
|
|
|
|
|
|
|
| Phenylalanine metabolism |
KEGG |
91 |
13 |
|
|
|
|
|
|
|
|
|
|
|
|
| response to wounding |
TAIR-GO |
90 |
9 |
|
|
|
|
|
|
|
|
|
|
|
|
|
| phenylpropanoid pathway, initial reactions |
AraCyc |
60 |
6 |
|
|
|
|
|
|
|
|
|
|
|
|
|
| Ascorbate and aldarate metabolism |
KEGG |
60 |
6 |
|
|
|
|
|
|
|
|
|
|
|
|
|
| Fluorene degradation |
KEGG |
52 |
6 |
|
|
|
|
|
|
|
|
|
|
|
|
|
| response to light |
TAIR-GO |
50 |
5 |
|
|
|
|
|
|
|
|
|
|
|
|
|
| gamma-Hexachlorocyclohexane degradation |
KEGG |
50 |
5 |
|
|
|
|
|
|
|
|
|
|
|
|
|
|
|
|
|
|
|
|
|
|
|
|
|
|
|
|
|
|
|
|
|
|
|
|
|
|
|
|
|
|
|
|
|
|
|
| Pathways co-expressed in the Organ and Tissue data set |
|
CYP98A3, C3'H (At2g4089) |
|
|
|
|
|
|
|
|
|
|
|
| max. difference between log2-ratios: |
5.16 |
|
|
|
|
|
|
|
|
|
|
|
|
|
|
|
| max. difference between log2-ratios excluding lowest and highest 5%: |
3.11 |
|
|
|
|
|
|
|
|
|
|
|
|
|
|
|
| Pathway |
Source |
Scores of Genes |
p[Score] |
No. of Genes |
p[genes] |
Link to organ heatmap showing details of all co-expressed genes |
|
|
|
|
|
|
|
| Phenylpropanoid pathway |
LitPath |
40 |
0.000 |
4 |
0.000 |

|
|
|
|
| core phenylpropanoid metabolism |
BioPath |
30 |
0.000 |
3 |
0.000 |
|
|
|
|
|
|
|
|
|
|
|
| Phenylpropanoid Metabolism |
BioPath |
30 |
0.000 |
3 |
0.000 |
|
|
|
|
|
|
|
|
|
|
|
| lignin biosynthesis |
AraCyc |
30 |
0.000 |
3 |
0.000 |
|
|
|
|
|
|
|
|
|
|
|
| suberin biosynthesis |
AraCyc |
30 |
0.000 |
3 |
0.000 |
|
|
|
|
|
|
|
|
|
|
|
| Stilbene, coumarine and lignin biosynthesis |
KEGG |
30 |
0.000 |
3 |
0.000 |
|
|
|
|
|
|
|
|
|
|
|
| phenylpropanoid biosynthesis |
TAIR-GO |
20 |
0.000 |
2 |
0.000 |
|
|
|
|
|
|
|
|
|
|
|
| response to wounding |
TAIR-GO |
20 |
0.000 |
2 |
0.000 |
|
|
|
|
|
|
|
|
|
|
|
| lignin biosynthesis |
TAIR-GO |
10 |
0.000 |
1 |
0.001 |
|
|
|
|
|
|
|
|
|
|
|
| phenylpropanoid metabolism |
TAIR-GO |
10 |
0.000 |
1 |
0.000 |
|
|
|
|
|
|
|
|
|
|
|
| response to light |
TAIR-GO |
10 |
0.000 |
1 |
0.011 |
|
|
|
|
|
|
|
|
|
|
|
| response to pathogenic fungi |
TAIR-GO |
10 |
0.000 |
1 |
0.000 |
|
|
|
|
|
|
|
|
|
|
|
| response to UV |
TAIR-GO |
10 |
0.000 |
1 |
0.001 |
|
|
|
|
|
|
|
|
|
|
|
| flavonoid biosynthesis |
AraCyc |
10 |
0.000 |
1 |
0.002 |
|
|
|
|
|
|
|
|
|
|
|
| phenylpropanoid biosynthesis |
AraCyc |
10 |
0.000 |
1 |
0.000 |
|
|
|
|
|
|
|
|
|
|
|
| phenylpropanoid pathway, initial reactions |
AraCyc |
10 |
0.000 |
1 |
0.000 |
|
|
|
|
|
|
|
|
|
|
|
| Ascorbate and aldarate metabolism |
KEGG |
10 |
0.000 |
1 |
0.001 |
|
|
|
|
|
|
|
|
|
|
|
| Fluorene degradation |
KEGG |
10 |
0.000 |
1 |
0.000 |
|
|
|
|
|
|
|
|
|
|
|
| gamma-Hexachlorocyclohexane degradation |
KEGG |
10 |
0.000 |
1 |
0.000 |
|
|
|
|
|
|
|
|
|
|
|
| Phenylalanine metabolism |
KEGG |
10 |
0.000 |
1 |
0.010 |
|
|
|
|
|
|
|
|
|
|
|
|
|
|
|
|
|
|
|
|
|
|
|
|
|
|
|
|
|
|
|
|
|
|
|
|
|
|
|
|
|
|
|
|
|
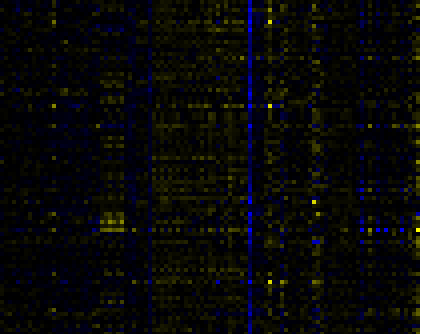
| Pathways co-expressed in the Stress data set |
|
CYP98A3, C3'H (At2g4089) |
|
|
|
|
|
|
|
|
|
|
|
| max. difference between log2-ratios: |
5.69 |
|
|
|
|
|
|
|
|
|
|
|
|
|
|
|
| max. difference between log2-ratios excluding lowest and highest 5%: |
1.38 |
|
|
|
|
|
|
|
|
|
|
|
|
|
|
|
| Pathway |
Source |
Scores of Genes |
p[Score] |
No. of Genes |
p[genes] |
|
|
|
|
|
|
|
|
|
|
|
| Phenylpropanoid Metabolism |
BioPath |
110 |
0.000 |
12 |
0.000 |
Link to stress heatmap showing details of all co-expressed genes |
|
|
|
|
|
|
|
| Phenylpropanoid pathway |
LitPath |
104 |
0.000 |
12 |
0.000 |
|
| lignin biosynthesis |
AraCyc |
90 |
0.000 |
9 |
0.000 |
| core phenylpropanoid metabolism |
BioPath |
80 |
0.000 |
8 |
0.000 |
| suberin biosynthesis |
AraCyc |
60 |
0.000 |
6 |
0.000 |
| lignin biosynthesis |
TAIR-GO |
50 |
0.000 |
5 |
0.000 |
| phenylpropanoid biosynthesis |
TAIR-GO |
50 |
0.000 |
5 |
0.000 |
| Stilbene, coumarine and lignin biosynthesis |
KEGG |
50 |
0.000 |
5 |
0.000 |
| Aromatic amino acid (Phe, Tyr, Trp) metabolism |
BioPath |
30 |
0.000 |
4 |
0.000 |
|
|
|
|
|
|
|
|
|
|
|
| response to wounding |
TAIR-GO |
30 |
0.000 |
3 |
0.000 |
|
|
|
|
|
|
|
|
|
|
|
| phenylpropanoid pathway, initial reactions |
AraCyc |
30 |
0.000 |
3 |
0.000 |
|
|
|
|
|
|
|
|
|
|
|
| biosynthesis of phenylpropanoids |
FunCat |
30 |
0.000 |
3 |
0.000 |
|
|
|
|
|
|
|
|
|
|
|
| biosynthesis of secondary products derived from L-phenylalanine and L-tyrosine |
FunCat |
30 |
0.000 |
3 |
0.000 |
|
|
|
|
|
|
|
|
|
|
|
| Phenylalanine metabolism |
KEGG |
30 |
0.000 |
3 |
0.004 |
|
|
|
|
|
|
|
|
|
|
|
| chorismate biosynthesis |
LitPath |
30 |
0.000 |
4 |
0.000 |
|
|
|
|
|
|
|
|
|
|
|
| Shikimate pathway |
LitPath |
30 |
0.000 |
4 |
0.004 |
|
|
|
|
|
|
|
|
|
|
|
| defense response |
TAIR-GO |
28 |
0.000 |
3 |
0.000 |
|
|
|
|
|
|
|
|
|
|
|
| aromatic amino acid family biosynthesis |
TAIR-GO |
26 |
0.000 |
3 |
0.000 |
|
|
|
|
|
|
|
|
|
|
|
| aromatic amino acid family biosynthesis, shikimate pathway |
TAIR-GO |
26 |
0.000 |
3 |
0.000 |
|
|
|
|
|
|
|
|
|
|
|
| Phenylalanine, tyrosine and tryptophan biosynthesis |
KEGG |
26 |
0.000 |
3 |
0.000 |
|
|
|
|
|
|
|
|
|
|
|
| biogenesis of cell wall |
FunCat |
22 |
0.000 |
3 |
0.001 |
|
|
|
|
|
|
|
|
|
|
|
| chorismate biosynthesis |
AraCyc |
20 |
0.000 |
3 |
0.000 |
|
|
|
|
|
|
|
|
|
|
|
| phenylpropanoid biosynthesis |
AraCyc |
20 |
0.000 |
2 |
0.000 |
|
|
|
|
|
|
|
|
|
|
|
| salicylic acid biosynthesis |
AraCyc |
20 |
0.000 |
2 |
0.000 |
|
|
|
|
|
|
|
|
|
|
|
| amino acid metabolism |
FunCat |
20 |
0.000 |
2 |
0.027 |
|
|
|
|
|
|
|
|
|
|
|
| metabolism of the cysteine - aromatic group |
FunCat |
20 |
0.000 |
2 |
0.000 |
|
|
|
|
|
|
|
|
|
|
|
| Alkaloid biosynthesis I |
KEGG |
20 |
0.000 |
2 |
0.001 |
|
|
|
|
|
|
|
|
|
|
|
| Alkaloid biosynthesis II |
KEGG |
20 |
0.000 |
2 |
0.000 |
|
|
|
|
|
|
|
|
|
|
|
| Ascorbate and aldarate metabolism |
KEGG |
20 |
0.000 |
2 |
0.001 |
|
|
|
|
|
|
|
|
|
|
|
| Fluorene degradation |
KEGG |
20 |
0.000 |
2 |
0.000 |
|
|
|
|
|
|
|
|
|
|
|
| gamma-Hexachlorocyclohexane degradation |
KEGG |
20 |
0.000 |
2 |
0.000 |
|
|
|
|
|
|
|
|
|
|
|
| Nitrogen metabolism |
KEGG |
20 |
0.000 |
2 |
0.002 |
|
|
|
|
|
|
|
|
|
|
|
| Tyrosine metabolism |
KEGG |
20 |
0.000 |
2 |
0.003 |
|
|
|
|
|
|
|
|
|
|
|
| glyphosate metabolism |
TAIR-GO |
16 |
0.000 |
2 |
0.000 |
|
|
|
|
|
|
|
|
|
|
|
| response to light |
TAIR-GO |
10 |
0.001 |
1 |
0.102 |
|
|
|
|
|
|
|
|
|
|
|
| alanine biosynthesis II |
AraCyc |
10 |
0.000 |
1 |
0.032 |
|
|
|
|
|
|
|
|
|
|
|
| ascorbate glutathione cycle |
AraCyc |
10 |
0.000 |
1 |
0.013 |
|
|
|
|
|
|
|
|
|
|
|
| phenylalanine biosynthesis II |
AraCyc |
10 |
0.000 |
1 |
0.025 |
|
|
|
|
|
|
|
|
|
|
|
| tyrosine biosynthesis I |
AraCyc |
10 |
0.000 |
1 |
0.004 |
|
|
|
|
|
|
|
|
|
|
|
| Flavonoid biosynthesis |
KEGG |
10 |
0.000 |
1 |
0.006 |
|
|
|
|
|
|
|
|
|
|
|
| Lipid signaling |
AcylLipid |
10 |
0.000 |
1 |
0.261 |
|
|
|
|
|
|
|
|
|
|
|
|
|
|
|
|
|
|
|
|
|
|
|
|
|
|
|
|
|
|
|
|
|
|
|
|
|
|
|
|
|
|
|
|
|
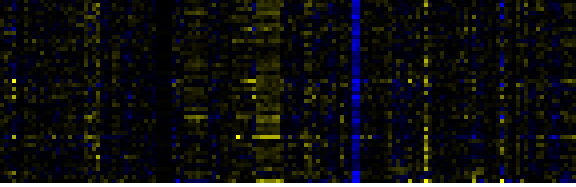
| Pathways co-expressed in the Hormone etc. data set |
|
CYP98A3, C3'H (At2g4089) |
|
|
|
|
|
|
|
|
|
|
|
| max. difference between log2-ratios: |
2.83 |
|
|
|
|
|
|
|
|
|
|
|
|
|
|
|
| max. difference between log2-ratios excluding lowest and highest 5%: |
0.63 |
|
|
|
|
|
|
|
|
|
|
|
|
|
|
|
| Pathway |
Source |
Scores of Genes |
p[Score] |
No. of Genes |
p[genes] |
|
|
|
|
|
|
|
|
|
|
|
| Phenylpropanoid pathway |
LitPath |
90 |
0.000 |
9 |
0.000 |
Link to hormones etc. heatmap showing details of all co-expressed genes |
|
|
|
|
|
|
|
| Phenylpropanoid Metabolism |
BioPath |
80 |
0.000 |
11 |
0.004 |
|
|
|
|
|
|
|
| lignin biosynthesis |
AraCyc |
80 |
0.000 |
8 |
0.000 |
|
|
|
|
|
|
| Folding, Sorting and Degradation |
KEGG |
74 |
0.000 |
14 |
0.000 |
|
|
|
|
|
|
| Stilbene, coumarine and lignin biosynthesis |
KEGG |
72 |
0.000 |
10 |
0.001 |
|
|
|
|
|
|
| core phenylpropanoid metabolism |
BioPath |
70 |
0.000 |
7 |
0.000 |
|
|
|
|
|
|
| protein catabolism |
TAIR-GO |
50 |
0.000 |
9 |
0.000 |
|
|
|
|
|
|
| ubiquitin-dependent protein catabolism |
TAIR-GO |
50 |
0.000 |
9 |
0.000 |
|
|
|
|
|
|
| suberin biosynthesis |
AraCyc |
50 |
0.000 |
5 |
0.000 |
|
|
|
|
|
|
| Proteasome |
KEGG |
50 |
0.000 |
9 |
0.000 |
|
|
|
|
|
|
| C-compound and carbohydrate metabolism |
FunCat |
49 |
0.001 |
9 |
0.125 |
|
|
|
|
|
|
| lignin biosynthesis |
TAIR-GO |
40 |
0.000 |
4 |
0.000 |
|
|
|
|
|
|
| Pyruvate metabolism |
KEGG |
39 |
0.000 |
5 |
0.036 |
|
|
|
|
|
|
| Glycolysis / Gluconeogenesis |
KEGG |
37 |
0.000 |
5 |
0.048 |
|
|
|
|
|
|
| Intermediary Carbon Metabolism |
BioPath |
36 |
0.027 |
6 |
0.184 |
|
|
|
|
|
|
| Plastidial Isoprenoids (Chlorophylls, Carotenoids, Tocopherols, Plastoquinone, Phylloquinone) |
BioPath |
32 |
0.008 |
4 |
0.099 |
|
|
|
|
|
|
| proteasome core complex (sensu Eukaryota) |
TAIR-GO |
30 |
0.000 |
5 |
0.000 |
|
|
|
|
|
|
| response to wounding |
TAIR-GO |
30 |
0.000 |
3 |
0.010 |
|
|
|
|
|
|
| biogenesis of chloroplast |
FunCat |
30 |
0.000 |
4 |
0.018 |
|
|
|
|
|
|
|
|
|
|
|
| Phenylalanine metabolism |
KEGG |
29 |
0.000 |
6 |
0.029 |
|
|
|
|
|
|
|
|
|
|
|
| tricarboxylic-acid pathway (citrate cycle, Krebs cycle, TCA cycle) |
FunCat |
26 |
0.000 |
3 |
0.253 |
|
|
|
|
|
|
|
|
|
|
|
| Translation factors |
KEGG |
25 |
0.001 |
4 |
0.173 |
|
|
|
|
|
|
|
|
|
|
|
| transport |
FunCat |
24 |
0.000 |
5 |
0.000 |
|
|
|
|
|
|
|
|
|
|
|
| flavonoid biosynthesis |
AraCyc |
22 |
0.000 |
3 |
0.009 |
|
|
|
|
|
|
|
|
|
|
|
| metabolism of acyl-lipids in mitochondria |
AcylLipid |
22 |
0.000 |
3 |
0.001 |
|
|
|
|
|
|
|
|
|
|
|
| Carbon fixation |
KEGG |
21 |
0.026 |
4 |
0.071 |
|
|
|
|
|
|
|
|
|
|
|
| Methane metabolism |
KEGG |
21 |
0.000 |
5 |
0.059 |
|
|
|
|
|
|
|
|
|
|
|
| Delta-pH pathway |
BioPath |
20 |
0.000 |
2 |
0.000 |
|
|
|
|
|
|
|
|
|
|
|
| Pathway for nuclear-encoded, thylakoid-localized proteins |
BioPath |
20 |
0.000 |
2 |
0.006 |
|
|
|
|
|
|
|
|
|
|
|
| phenylpropanoid biosynthesis |
TAIR-GO |
20 |
0.000 |
2 |
0.001 |
|
|
|
|
|
|
|
|
|
|
|
| phenylpropanoid metabolism |
TAIR-GO |
20 |
0.000 |
2 |
0.001 |
|
|
|
|
|
|
|
|
|
|
|
| response to light |
TAIR-GO |
20 |
0.000 |
2 |
0.180 |
|
|
|
|
|
|
|
|
|
|
|
| response to pathogenic fungi |
TAIR-GO |
20 |
0.000 |
2 |
0.000 |
|
|
|
|
|
|
|
|
|
|
|
| response to UV |
TAIR-GO |
20 |
0.000 |
2 |
0.013 |
|
|
|
|
|
|
|
|
|
|
|
| phenylpropanoid biosynthesis |
AraCyc |
20 |
0.000 |
2 |
0.001 |
|
|
|
|
|
|
|
|
|
|
|
| Ascorbate and aldarate metabolism |
KEGG |
20 |
0.000 |
2 |
0.053 |
|
|
|
|
|
|
|
|
|
|
|
| Carotenoid biosynthesis |
BioPath |
18 |
0.000 |
2 |
0.004 |
|
|
|
|
|
|
|
|
|
|
|
| carotenoid biosynthesis |
AraCyc |
18 |
0.000 |
2 |
0.003 |
|
|
|
|
|
|
|
|
|
|
|
| biosynthesis of derivatives of homoisopentenyl pyrophosphate |
FunCat |
18 |
0.000 |
2 |
0.006 |
|
|
|
|
|
|
|
|
|
|
|
| ATP synthesis |
KEGG |
18 |
0.000 |
5 |
0.002 |
|
|
|
|
|
|
|
|
|
|
|
| Oxidative phosphorylation |
KEGG |
18 |
0.015 |
7 |
0.003 |
|
|
|
|
|
|
|
|
|
|
|
| Tyrosine metabolism |
KEGG |
18 |
0.001 |
3 |
0.047 |
|
|
|
|
|
|
|
|
|
|
|
| carotenid biosynthesis |
LitPath |
18 |
0.000 |
2 |
0.003 |
|
|
|
|
|
|
|
|
|
|
|
| Carotenoid and abscisic acid metabolism |
LitPath |
18 |
0.000 |
2 |
0.018 |
|
|
|
|
|
|
|
|
|
|
|
| additional photosystem II components |
BioPath |
16 |
0.009 |
2 |
0.108 |
|
|
|
|
|
|
|
|
|
|
|
| Chloroplastic protein turnover |
BioPath |
16 |
0.000 |
4 |
0.000 |
|
|
|
|
|
|
|
|
|
|
|
| ClpP protease complex |
BioPath |
16 |
0.000 |
4 |
0.000 |
|
|
|
|
|
|
|
|
|
|
|
| Early light-inducible proteins |
BioPath |
16 |
0.000 |
2 |
0.001 |
|
|
|
|
|
|
|
|
|
|
|
| ATP-dependent proteolysis |
TAIR-GO |
16 |
0.000 |
4 |
0.000 |
|
|
|
|
|
|
|
|
|
|
|
| acetate fermentation |
AraCyc |
16 |
0.008 |
5 |
0.018 |
|
|
|
|
|
|
|
|
|
|
|
|
|
|
|
|
|
|
|
|
|
|
|
|
|
|
|
|
|
|
|
|
|
|
|
|
|
|
|
|
|
|
|
|
|
|
|
|
|
|
|
|
|
|
|
|
|
|
|
|
|
|
| Pathways co-expressed in the Mutant data set |
|
CYP98A3, C3'H (At2g4089) |
|
|
|
|
|
|
|
|
|
|
|
| max. difference between log2-ratios: |
3.79 |
|
|
|
|
|
|
|
|
|
|
|
|
|
|
|
| max. difference between log2-ratios excluding lowest and highest 5%: |
0.99 |
|
|
|
|
|
|
|
|
|
|
|
|
|
|
|
| Pathway |
Source |
Scores of Genes |
p[Score] |
No. of Genes |
p[genes] |
|
|
|
|
|
|
|
|
|
|
|
| Folding, Sorting and Degradation |
KEGG |
51 |
0.000 |
10 |
0.000 |
Link to mutant heatmap showing details of all co-expressed genes |
|
|
|
|
|
|
|
| Proteasome |
KEGG |
49 |
0.000 |
9 |
0.000 |
|
|
|
|
|
| protein catabolism |
TAIR-GO |
47 |
0.000 |
8 |
0.000 |
|
|
|
|
| ubiquitin-dependent protein catabolism |
TAIR-GO |
47 |
0.000 |
8 |
0.000 |
|
|
|
|
| Phenylpropanoid Metabolism |
BioPath |
44 |
0.000 |
5 |
0.001 |
|
|
|
|
| core phenylpropanoid metabolism |
BioPath |
40 |
0.000 |
4 |
0.000 |
|
|
|
|
| lignin biosynthesis |
AraCyc |
40 |
0.000 |
4 |
0.000 |
|
|
|
|
| Phenylpropanoid pathway |
LitPath |
40 |
0.000 |
4 |
0.000 |
|
|
|
|
| Stilbene, coumarine and lignin biosynthesis |
KEGG |
32 |
0.000 |
4 |
0.032 |
|
|
|
|
| lignin biosynthesis |
TAIR-GO |
30 |
0.000 |
3 |
0.000 |
|
|
|
|
| proteasome core complex (sensu Eukaryota) |
TAIR-GO |
30 |
0.000 |
5 |
0.000 |
|
|
|
|
| Phenylalanine metabolism |
KEGG |
22 |
0.000 |
3 |
0.070 |
|
|
|
|
|
|
|
|
|
|
|
| phenylpropanoid biosynthesis |
TAIR-GO |
20 |
0.000 |
2 |
0.000 |
|
|
|
|
|
|
|
|
|
|
|
| suberin biosynthesis |
AraCyc |
20 |
0.000 |
2 |
0.001 |
|
|
|
|
|
|
|
|
|
|
|
| amino acid metabolism |
FunCat |
20 |
0.000 |
3 |
0.027 |
|
|
|
|
|
|
|
|
|
|
|
| Oxidative phosphorylation |
KEGG |
17 |
0.000 |
4 |
0.009 |
|
|
|
|
|
|
|
|
|
|
|
| biogenesis of chloroplast |
FunCat |
16 |
0.000 |
2 |
0.030 |
|
|
|
|
|
|
|
|
|
|
|
| degradation |
FunCat |
15 |
0.000 |
2 |
0.003 |
|
|
|
|
|
|
|
|
|
|
|
| protein degradation |
FunCat |
15 |
0.000 |
2 |
0.001 |
|
|
|
|
|
|
|
|
|
|
|
| Carbon fixation |
KEGG |
14 |
0.008 |
2 |
0.111 |
|
|
|
|
|
|
|
|
|
|
|
| Gluconeogenesis from lipids in seeds |
BioPath |
10 |
0.001 |
1 |
0.092 |
|
|
|
|
|
|
|
|
|
|
|
| leaf senescence |
TAIR-GO |
10 |
0.000 |
1 |
0.000 |
|
|
|
|
|
|
|
|
|
|
|
| nitrogen compound metabolism |
TAIR-GO |
10 |
0.000 |
1 |
0.001 |
|
|
|
|
|
|
|
|
|
|
|
| response to light |
TAIR-GO |
10 |
0.001 |
1 |
0.146 |
|
|
|
|
|
|
|
|
|
|
|
| response to wounding |
TAIR-GO |
10 |
0.000 |
1 |
0.060 |
|
|
|
|
|
|
|
|
|
|
|
| asparagine biosynthesis I |
AraCyc |
10 |
0.000 |
1 |
0.003 |
|
|
|
|
|
|
|
|
|
|
|
| asparagine degradation I |
AraCyc |
10 |
0.000 |
1 |
0.012 |
|
|
|
|
|
|
|
|
|
|
|
| aspartate biosynthesis and degradation |
AraCyc |
10 |
0.000 |
1 |
0.002 |
|
|
|
|
|
|
|
|
|
|
|
| aspartate degradation I |
AraCyc |
10 |
0.000 |
1 |
0.035 |
|
|
|
|
|
|
|
|
|
|
|
| aspartate degradation II |
AraCyc |
10 |
0.000 |
1 |
0.014 |
|
|
|
|
|
|
|
|
|
|
|
| formylTHF biosynthesis |
AraCyc |
10 |
0.000 |
2 |
0.001 |
|
|
|
|
|
|
|
|
|
|
|
| glutamine degradation III |
AraCyc |
10 |
0.000 |
1 |
0.006 |
|
|
|
|
|
|
|
|
|
|
|
| phenylpropanoid biosynthesis |
AraCyc |
10 |
0.000 |
1 |
0.002 |
|
|
|
|
|
|
|
|
|
|
|
| phenylpropanoid pathway, initial reactions |
AraCyc |
10 |
0.000 |
1 |
0.001 |
|
|
|
|
|
|
|
|
|
|
|
| photorespiration |
AraCyc |
10 |
0.000 |
2 |
0.007 |
|
|
|
|
|
|
|
|
|
|
|
| metabolism of the aspartate family |
FunCat |
10 |
0.000 |
1 |
0.003 |
|
|
|
|
|
|
|
|
|
|
|
| nitrogen and sulfur biogenesis of chloroplast |
FunCat |
10 |
0.000 |
1 |
0.000 |
|
|
|
|
|
|
|
|
|
|
|
| transport |
FunCat |
10 |
0.000 |
3 |
0.000 |
|
|
|
|
|
|
|
|
|
|
|
| transport facilitation |
FunCat |
10 |
0.000 |
3 |
0.000 |
|
|
|
|
|
|
|
|
|
|
|
| Alanine and aspartate metabolism |
KEGG |
10 |
0.001 |
1 |
0.106 |
|
|
|
|
|
|
|
|
|
|
|
| Alkaloid biosynthesis I |
KEGG |
10 |
0.000 |
1 |
0.058 |
|
|
|
|
|
|
|
|
|
|
|
| Arginine and proline metabolism |
KEGG |
10 |
0.006 |
1 |
0.174 |
|
|
|
|
|
|
|
|
|
|
|
| Ascorbate and aldarate metabolism |
KEGG |
10 |
0.001 |
1 |
0.073 |
|
|
|
|
|
|
|
|
|
|
|
| Cysteine metabolism |
KEGG |
10 |
0.001 |
1 |
0.084 |
|
|
|
|
|
|
|
|
|
|
|
| Fluorene degradation |
KEGG |
10 |
0.000 |
1 |
0.029 |
|
|
|
|
|
|
|
|
|
|
|
| gamma-Hexachlorocyclohexane degradation |
KEGG |
10 |
0.000 |
1 |
0.036 |
|
|
|
|
|
|
|
|
|
|
|
| Glutamate metabolism |
KEGG |
10 |
0.036 |
1 |
0.180 |
|
|
|
|
|
|
|
|
|
|
|
| Novobiocin biosynthesis |
KEGG |
10 |
0.000 |
1 |
0.022 |
|
|
|
|
|
|
|
|
|
|
|
| Phenylalanine, tyrosine and tryptophan biosynthesis |
KEGG |
10 |
0.028 |
1 |
0.180 |
|
|
|
|
|
|
|
|
|
|
|
| Tyrosine metabolism |
KEGG |
10 |
0.007 |
1 |
0.161 |
|
|
|
|
|
|
|
|
|
|
|
|
|
|
|
|
|
|
|
|
|
|
|
|
|
|
|
|