
| Co-Expression Analysis of: | CYPedia Home | Institut de Biologie Moléculaire des Plantes (Home) | ||||||||||||||
| CYP78A9 (At3g61880) | save all data as Tab Delimited Table | |||||||||||||||
| _________________________________________ | ||||||||||||||||
| Pathways co-expressed in all the 3 data sets with co-expressed pathways (with more than 6 annotation points each) | Find below a list of pathways that are co-expressed with the bait. First a list of pathways is given that are co-expressed in all data sets. Lists for each individual dataset are shown underneath. Depending on the number of co-expressed pathways only the top scoring pathways are given; all data can be saved as text using the link above. |
|
||||||||||||||
| there are no pathways co-expressed in all 3 data sets | ||||||||||||||||
| To the right of each table a thumbnail of the actual co-expression heatmap is given. Klick on the link to see the heatmap containing all co-expressed genes. | ||||||||||||||||
| For more information on how these pathway maps were generated please read the methods page | ||||||||||||||||
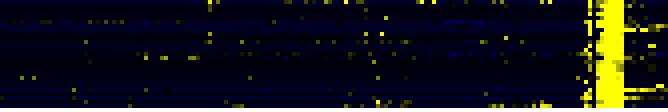
| Pathways co-expressed in the Organ and Tissue data set (with more than 6 annotation points) | CYP78A9 (At3g61880) | |||||||||||||||
| max. difference between log2-ratios: | 6.2 | |||||||||||||||
| max. difference between log2-ratios excluding lowest and highest 5%: | 3.4 | |||||||||||||||
| Pathway | Source | Scores of Genes | p[Score] | No. of Genes | p[genes] | Link to organ heatmap | ||||||||||
| Cell Wall Carbohydrate Metabolism | BioPath | 18 | 0.000 | 5 | 0.005 |
|
||||||||||
| isoprenoid biosynthesis | FunCat | 12 | 0.000 | 2 | 0.007 | |||||||||||
| lipid, fatty acid and isoprenoid biosynthesis | FunCat | 12 | 0.000 | 2 | 0.005 | |||||||||||
| sucrose metabolism | BioPath | 10 | 0.000 | 1 | 0.004 | |||||||||||
| response to hypoxia | TAIR-GO | 10 | 0.000 | 1 | 0.000 | |||||||||||
| sucrose biosynthesis | AraCyc | 10 | 0.000 | 1 | 0.002 | |||||||||||
| sucrose degradation III | AraCyc | 10 | 0.000 | 1 | 0.001 | |||||||||||
| glycolysis and gluconeogenesis | FunCat | 10 | 0.001 | 1 | 0.185 | |||||||||||
| Starch and sucrose metabolism | KEGG | 10 | 0.000 | 1 | 0.001 | |||||||||||
| pectin metabolism | BioPath | 8 | 0.000 | 4 | 0.001 | |||||||||||
| fatty acid elongation | TAIR-GO | 8 | 0.000 | 1 | 0.000 | |||||||||||
| fatty acid metabolism | TAIR-GO | 8 | 0.000 | 1 | 0.005 | |||||||||||
| long-chain fatty acid metabolism | TAIR-GO | 8 | 0.000 | 1 | 0.002 | |||||||||||
| very-long-chain fatty acid metabolism | TAIR-GO | 8 | 0.000 | 1 | 0.002 | |||||||||||
| Fatty acid elongation and wax and cutin metabolism | AcylLipid | 8 | 0.000 | 1 | 0.036 | |||||||||||
| secondary metabolism | TAIR-GO | 7 | 0.000 | 1 | 0.000 | |||||||||||
| degradation | FunCat | 7 | 0.000 | 1 | 0.013 | |||||||||||
| protein degradation | FunCat | 7 | 0.000 | 1 | 0.007 | |||||||||||
| Pathways co-expressed in the Stress data set ( with more than 6 annotation points) | CYP78A9 (At3g61880) | |||||||||||||||
| max. difference between log2-ratios: | 6.7 | |||||||||||||||
| max. difference between log2-ratios excluding lowest and highest 5%: | 1.4 | |||||||||||||||
| Link to stress heatmap | ||||||||||||||||
| there are no co-expressed genes with more than 6 annotation points | ||||||||||||||||
| Pathways co-expressed in the Hormone etc. data set (with more than 10 annotation points) | CYP78A9 (At3g61880) | |||||||||||||||
| max. difference between log2-ratios: | 3.9 | |||||||||||||||
| max. difference between log2-ratios excluding lowest and highest 5%: | 0.0 | |||||||||||||||
| Pathway | Source | Scores of Genes | p[Score] | No. of Genes | p[genes] | Link to hormones etc. heatmap | ||||||||||
| Phenylpropanoid pathway | LitPath | 12 | 0.000 | 2 | 0.006 | |||||||||||
| core phenylpropanoid metabolism | BioPath | 10 | 0.000 | 1 | 0.004 | |||||||||||
| Phenylpropanoid Metabolism | BioPath | 10 | 0.000 | 1 | 0.053 | |||||||||||
| biogenesis of cell wall | FunCat | 10 | 0.000 | 1 | 0.002 | |||||||||||
| histone acetylation | TAIR-GO | 7 | 0.000 | 1 | 0.000 | |||||||||||
| response to light | TAIR-GO | 7 | 0.000 | 1 | 0.007 | |||||||||||
| transcription factor TFIID complex | TAIR-GO | 7 | 0.000 | 1 | 0.000 | |||||||||||
| Basal transcription factors | KEGG | 7 | 0.000 | 1 | 0.000 | |||||||||||
| Transcription | KEGG | 7 | 0.000 | 1 | 0.000 | |||||||||||
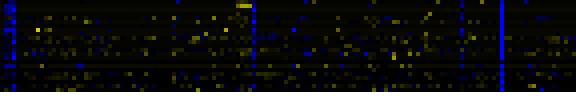
| Pathways co-expressed in the Mutant data set (with more than 6 annotation points) | CYP78A9 (At3g61880) | |||||||||||||||
| max. difference between log2-ratios: | 3.5 | |||||||||||||||
| max. difference between log2-ratios excluding lowest and highest 5%: | 0.9 | |||||||||||||||
| Pathway | Source | Scores of Genes | p[Score] | No. of Genes | p[genes] | Link to mutants heatmap | ||||||||||
| Miscellaneous acyl lipid metabolism | AcylLipid | 12 | 0.000 | 2 | 0.019 |
|
||||||||||
| acyl-CoA binding | TAIR-GO | 10 | 0.000 | 1 | 0.000 | |||||||||||
| lipid transport | TAIR-GO | 10 | 0.000 | 1 | 0.000 | |||||||||||
| Ribosome | KEGG | 10 | 0.000 | 2 | 0.005 | |||||||||||
| mono-/sesqui-/di-terpene biosynthesis | LitPath | 10 | 0.000 | 1 | 0.019 | |||||||||||
| sequiterpene biosynthesis | LitPath | 10 | 0.000 | 1 | 0.000 | |||||||||||
| terpenoid metabolism | LitPath | 10 | 0.000 | 1 | 0.020 | |||||||||||
| male gamete generation (sensu Magnoliophyta) | TAIR-GO | 7 | 0.000 | 1 | 0.000 | |||||||||||
| secondary metabolism | TAIR-GO | 7 | 0.000 | 1 | 0.000 | |||||||||||
| degradation | FunCat | 7 | 0.000 | 1 | 0.009 | |||||||||||
| protein degradation | FunCat | 7 | 0.000 | 1 | 0.005 | |||||||||||
| metabolism of acyl-lipids in mitochondria | AcylLipid | 7 | 0.000 | 1 | 0.006 | |||||||||||
| page created by Juergen Ehlting | 04/24/06 | |||||||||||||||