| _________________________________________ |
|
|
|
|
|
|
|
|
|
|
|
|
|
|
|
| Pathways co-expressed in all 4 data sets (with more than 6 annotation points each) |
|
Find below a list of pathways that are co-expressed with the bait. First a list of pathways is given that are co-expressed in all data sets. Lists for each individual dataset are shown underneath. Depending on the number of co-expressed pathways only the top scoring pathways are given; all data can be saved as text using the link above. |
|
|
|
|
|
|
| Pathway |
Source |
Sum of scores |
Sum of genes |
|
|
|
|
|
|
|
| chlorophyll biosynthesis |
AraCyc |
314 |
38 |
|
|
|
|
|
|
|
| photosynthesis |
FunCat |
305 |
48 |
|
|
|
|
|
|
|
|
|
| chlorophyll biosynthesis |
TAIR-GO |
261 |
30 |
|
|
|
|
|
|
|
|
|
| chlorophyll biosynthesis |
LitPath |
235 |
27 |
|
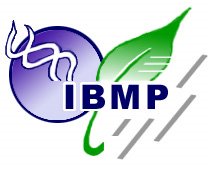
To the right of each table a thumbnail of the actual co-expression heatmap is given. Klick on the link to see the heatmap containing all co-expressed genes. |
|
|
|
|
|
|
|
|
| photosynthesis |
TAIR-GO |
189 |
28 |
|
|
|
|
|
|
|
|
|
| mRNA processing in chloroplast |
BioPath |
116 |
23 |
|
|
|
|
|
|
|
|
|
| photorespiration |
AraCyc |
87 |
21 |
|
For more information on how these pathway maps were generated please read the methods page |
|
|
|
|
|
|
|
|
| carotenoid biosynthesis |
AraCyc |
85 |
9 |
|
|
|
|
|
|
|
|
|
| photorespiration |
TAIR-GO |
73 |
16 |
|
|
|
|
|
|
|
|
|
|
|
|
|
| Carotenoid and abscisic acid metabolism |
LitPath |
60 |
7 |
|
|
|
|
|
|
|
|
|
|
|
|
|
| carotenoid biosynthesis |
TAIR-GO |
47 |
4 |
|
|
|
|
|
|
|
|
|
|
|
|
|
| carotenoid degradation |
LitPath |
36 |
4 |
|
|
|
|
|
|
|
|
|
|
|
|
|
|
|
|
|
|
|
|
|
|
|
|
|
|
|
|
|
|
|
|
|
|
|
|
|
|
|
|
|
|
|
|
|
|
|
| Pathways co-expressed in the Organ and Tissue data set (with more than 39 annotation points) |
|
CYP97C1, LUT1 (At3g53130) |
|
|
|
|
|
|
|
|
| max. difference between log2-ratios: |
3.7 |
|
|
|
|
|
|
|
|
|
|
|
|
| max. difference between log2-ratios excluding lowest and highest 5%: |
2.6 |
|
|
|
|
|
|
|
|
|
|
|
|
| Pathway |
Source |
Scores of Genes |
p[Score] |
No. of Genes |
p[genes] |
Link to organ heatmap |
|
|
|
|
|
|
|
| Photosystems |
BioPath |
312 |
0.000 |
50 |
0.000 |
|
|
|
| Plastidial Isoprenoids (Chlorophylls, Carotenoids, Tocopherols, Plastoquinone, Phylloquinone) |
BioPath |
301 |
0.000 |
37 |
0.000 |
|
|
| biogenesis of chloroplast |
FunCat |
185 |
0.000 |
29 |
0.000 |
|
|
| Chlorophyll biosynthesis and breakdown |
BioPath |
183 |
0.000 |
22 |
0.000 |
|
|
| C-compound and carbohydrate metabolism |
FunCat |
178 |
0.000 |
29 |
0.040 |
|
|
| chlorophyll and phytochromobilin metabolism |
LitPath |
177 |
0.000 |
21 |
0.000 |
|
|
| photosynthesis |
FunCat |
152 |
0.000 |
25 |
0.000 |
|
|
| Intermediary Carbon Metabolism |
BioPath |
146 |
0.049 |
23 |
0.339 |
|
|
| Porphyrin and chlorophyll metabolism |
KEGG |
141 |
0.000 |
17 |
0.000 |
|
|
| additional photosystem II components |
BioPath |
129 |
0.000 |
20 |
0.000 |
|
|
| chlorophyll biosynthesis |
AraCyc |
128 |
0.000 |
16 |
0.000 |
|
|
| Photosynthesis |
KEGG |
127 |
0.000 |
23 |
0.000 |
|
|
| glycolysis and gluconeogenesis |
FunCat |
117 |
0.000 |
19 |
0.001 |
|
|
|
|
|
|
|
|
|
|
|
| Carbon fixation |
KEGG |
113 |
0.000 |
18 |
0.000 |
|
|
|
|
|
|
|
|
|
|
|
| Photosystem I |
BioPath |
103 |
0.000 |
18 |
0.000 |
|
|
|
|
|
|
|
|
|
|
|
| Leaf Glycerolipid Biosynthesis in Plastid |
BioPath |
81 |
0.004 |
9 |
0.263 |
|
|
|
|
|
|
|
|
|
|
|
| biosynthesis of proto- and siroheme |
AraCyc |
80 |
0.000 |
12 |
0.000 |
|
|
|
|
|
|
|
|
|
|
|
| chlorophyll biosynthesis |
TAIR-GO |
75 |
0.000 |
8 |
0.000 |
|
|
|
|
|
|
|
|
|
|
|
| Glycolysis / Gluconeogenesis |
KEGG |
74 |
0.000 |
11 |
0.003 |
|
|
|
|
|
|
|
|
|
|
|
| Calvin cycle |
AraCyc |
73 |
0.000 |
14 |
0.000 |
|
|
|
|
|
|
|
|
|
|
|
| Chlorophyll a/b binding proteins |
BioPath |
70 |
0.000 |
9 |
0.000 |
|
|
|
|
|
|
|
|
|
|
|
| chlorophyll and phyochromobilin biosynthesis |
LitPath |
68 |
0.000 |
10 |
0.000 |
|
|
|
|
|
|
|
|
|
|
|
| porphyrin biosynthesis |
TAIR-GO |
66 |
0.000 |
9 |
0.000 |
|
|
|
|
|
|
|
|
|
|
|
| acetate fermentation |
AraCyc |
66 |
0.000 |
11 |
0.016 |
|
|
|
|
|
|
|
|
|
|
|
| fructose degradation (anaerobic) |
AraCyc |
66 |
0.000 |
11 |
0.009 |
|
|
|
|
|
|
|
|
|
|
|
| glycolysis I |
AraCyc |
66 |
0.024 |
11 |
0.481 |
|
|
|
|
|
|
|
|
|
|
|
| glycolysis IV |
AraCyc |
66 |
0.000 |
11 |
0.010 |
|
|
|
|
|
|
|
|
|
|
|
| sorbitol fermentation |
AraCyc |
66 |
0.000 |
11 |
0.013 |
|
|
|
|
|
|
|
|
|
|
|
| Synthesis of membrane lipids in plastids |
AcylLipid |
65 |
0.000 |
7 |
0.000 |
|
|
|
|
|
|
|
|
|
|
|
| transport |
FunCat |
64 |
0.000 |
11 |
0.000 |
|
|
|
|
|
|
|
|
|
|
|
| Photosystem II |
BioPath |
59 |
0.003 |
9 |
0.036 |
|
|
|
|
|
|
|
|
|
|
|
| gluconeogenesis |
AraCyc |
58 |
0.000 |
9 |
0.005 |
|
|
|
|
|
|
|
|
|
|
|
| starch metabolism |
BioPath |
57 |
0.000 |
9 |
0.005 |
|
|
|
|
|
|
|
|
|
|
|
| Pentose phosphate pathway |
KEGG |
55 |
0.000 |
9 |
0.000 |
|
|
|
|
|
|
|
|
|
|
|
| photosystem I |
TAIR-GO |
54 |
0.000 |
7 |
0.000 |
|
|
|
|
|
|
|
|
|
|
|
| Pathway for nuclear-encoded, thylakoid-localized proteins |
BioPath |
52 |
0.000 |
7 |
0.000 |
|
|
|
|
|
|
|
|
|
|
|
| Folding, Sorting and Degradation |
KEGG |
52 |
0.017 |
8 |
0.244 |
|
|
|
|
|
|
|
|
|
|
|
| mRNA processing in chloroplast |
BioPath |
50 |
0.000 |
10 |
0.000 |
|
|
|
|
|
|
|
|
|
|
|
| Carotenoid and abscisic acid metabolism |
LitPath |
40 |
0.000 |
5 |
0.007 |
|
|
|
|
|
|
|
|
|
|
|
| chlorophyll biosynthesis |
LitPath |
49 |
0.000 |
5 |
0.000 |
|
|
|
|
|
|
|
|
|
|
|
| Transcription (chloroplast) |
BioPath |
44 |
0.000 |
5 |
0.000 |
|
|
|
|
|
|
|
|
|
|
|
| transcription initiation |
TAIR-GO |
44 |
0.000 |
5 |
0.000 |
|
|
|
|
|
|
|
|
|
|
|
| transport facilitation |
FunCat |
43 |
0.000 |
7 |
0.000 |
|
|
|
|
|
|
|
|
|
|
|
| Fructose and mannose metabolism |
KEGG |
42 |
0.000 |
6 |
0.025 |
|
|
|
|
|
|
|
|
|
|
|
| Carotenoid biosynthesis |
BioPath |
40 |
0.000 |
5 |
0.002 |
|
|
|
|
|
|
|
|
|
|
|
| Biosynthesis of steroids |
KEGG |
40 |
0.003 |
4 |
0.168 |
|
|
|
|
|
|
|
|
|
|
|
| carotenid biosynthesis |
LitPath |
40 |
0.000 |
5 |
0.001 |
|
|
|
|
|
|
|
|
|
|
|
|
|
|
|
|
|
|
|
|
|
|
|
|
|
|
|
|
|
|
|
|
|
|
|
|
|
|
|
|
|
|
|
|
|
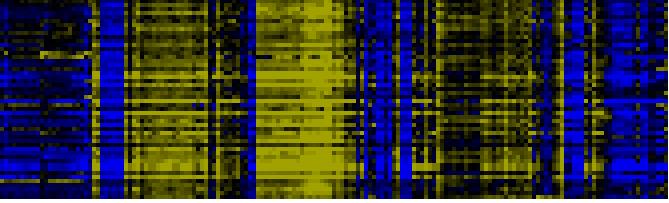
| Pathways co-expressed in the Stress data set ( with more than 30 annotation points) |
|
CYP97C1, LUT1 (At3g53130) |
|
|
|
|
|
|
|
|
| max. difference between log2-ratios: |
3.9 |
|
|
|
|
|
|
|
|
|
|
|
|
| max. difference between log2-ratios excluding lowest and highest 5%: |
1.7 |
|
|
|
|
|
|
|
|
|
|
|
|
| Pathway |
Source |
Scores of Genes |
p[Score] |
No. of Genes |
p[genes] |
Link to stress heatmap |
|
|
|
|
|
|
|
| Photosystems |
BioPath |
146 |
0.000 |
24 |
0.000 |
|
| Plastidial Isoprenoids (Chlorophylls, Carotenoids, Tocopherols, Plastoquinone, Phylloquinone) |
BioPath |
145 |
0.000 |
18 |
0.000 |
| C-compound and carbohydrate metabolism |
FunCat |
123 |
0.000 |
20 |
0.020 |
| photosynthesis |
FunCat |
112 |
0.000 |
17 |
0.000 |
| biogenesis of chloroplast |
FunCat |
111 |
0.000 |
18 |
0.000 |
| Intermediary Carbon Metabolism |
BioPath |
98 |
0.000 |
14 |
0.184 |
| Chlorophyll biosynthesis and breakdown |
BioPath |
89 |
0.000 |
11 |
0.000 |
| Porphyrin and chlorophyll metabolism |
KEGG |
85 |
0.000 |
10 |
0.000 |
| chlorophyll and phytochromobilin metabolism |
LitPath |
83 |
0.000 |
10 |
0.000 |
| chlorophyll biosynthesis |
AraCyc |
76 |
0.000 |
10 |
0.000 |
| glycolysis and gluconeogenesis |
FunCat |
67 |
0.000 |
10 |
0.030 |
| Ribosome |
KEGG |
66 |
0.033 |
16 |
0.007 |
| Carbon fixation |
KEGG |
65 |
0.000 |
10 |
0.000 |
| additional photosystem II components |
BioPath |
61 |
0.000 |
11 |
0.000 |
|
|
|
|
|
|
|
|
|
|
|
| chlorophyll biosynthesis |
TAIR-GO |
55 |
0.000 |
6 |
0.000 |
|
|
|
|
|
|
|
|
|
|
|
| protein synthesis |
FunCat |
52 |
0.000 |
14 |
0.001 |
|
|
|
|
|
|
|
|
|
|
|
| Photosynthesis |
KEGG |
49 |
0.000 |
11 |
0.000 |
|
|
|
|
|
|
|
|
|
|
|
| Calvin cycle |
AraCyc |
48 |
0.000 |
9 |
0.000 |
|
|
|
|
|
|
|
|
|
|
|
| Glycolysis / Gluconeogenesis |
KEGG |
44 |
0.000 |
6 |
0.018 |
|
|
|
|
|
|
|
|
|
|
|
| Pentose phosphate pathway |
KEGG |
44 |
0.000 |
7 |
0.000 |
|
|
|
|
|
|
|
|
|
|
|
| mRNA processing in chloroplast |
BioPath |
42 |
0.000 |
8 |
0.000 |
|
|
|
|
|
|
|
|
|
|
|
| gluconeogenesis |
AraCyc |
42 |
0.000 |
6 |
0.009 |
|
|
|
|
|
|
|
|
|
|
|
| Leaf Glycerolipid Biosynthesis in Plastid |
BioPath |
41 |
0.049 |
5 |
0.246 |
|
|
|
|
|
|
|
|
|
|
|
| Photosystem I |
BioPath |
39 |
0.036 |
6 |
0.126 |
|
|
|
|
|
|
|
|
|
|
|
| chlorophyll biosynthesis |
LitPath |
39 |
0.000 |
4 |
0.000 |
|
|
|
|
|
|
|
|
|
|
|
| biosynthesis of proto- and siroheme |
AraCyc |
36 |
0.000 |
6 |
0.005 |
|
|
|
|
|
|
|
|
|
|
|
| Photosystem II |
BioPath |
35 |
0.003 |
5 |
0.065 |
|
|
|
|
|
|
|
|
|
|
|
| Synthesis of membrane lipids in plastids |
AcylLipid |
35 |
0.000 |
4 |
0.000 |
|
|
|
|
|
|
|
|
|
|
|
| Translation factors |
KEGG |
32 |
0.000 |
9 |
0.001 |
|
|
|
|
|
|
|
|
|
|
|
|
|
|
|
|
|
|
|
|
|
|
|
|
|
|
|
|
|
|
|
|
|
|
|
|
|
|
|
|
|
|
|
|
|
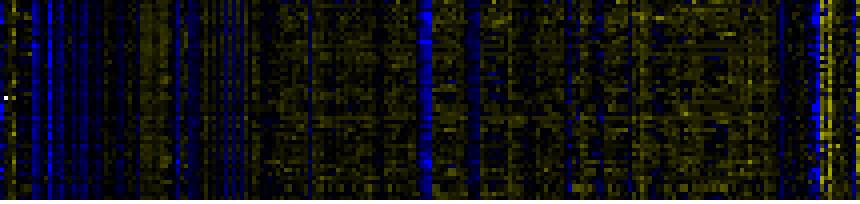
| Pathways co-expressed in the Hormone etc. data set (with more than 10 annotation points) |
|
CYP97C1, LUT1 (At3g53130) |
|
|
|
|
|
|
|
|
| max. difference between log2-ratios: |
2.1 |
|
|
|
|
|
|
|
|
|
|
|
|
| max. difference between log2-ratios excluding lowest and highest 5%: |
0.9 |
|
|
|
|
|
|
|
|
|
|
|
|
| Pathway |
Source |
Scores of Genes |
p[Score] |
No. of Genes |
p[genes] |
Link to hormones etc. heatmap |
|
|
|
|
|
|
|
| biogenesis of chloroplast |
FunCat |
35 |
0.000 |
5 |
0.000 |
|
|
|
|
|
|
| protein folding |
TAIR-GO |
32 |
0.000 |
4 |
0.000 |
|
|
|
|
|
| Leaf Glycerolipid Biosynthesis |
BioPath |
27 |
0.004 |
3 |
0.194 |
|
|
|
|
|
| Leaf Glycerolipid Biosynthesis in Plastid |
BioPath |
27 |
0.000 |
3 |
0.006 |
|
|
|
|
|
| glycosylglyceride desaturation pathway |
AraCyc |
27 |
0.000 |
3 |
0.000 |
|
|
|
|
|
| Synthesis of membrane lipids in plastids |
AcylLipid |
27 |
0.000 |
3 |
0.000 |
|
|
|
|
|
| Ribosome |
KEGG |
24 |
0.002 |
5 |
0.023 |
|
|
|
|
|
| C-compound and carbohydrate metabolism |
FunCat |
21 |
0.001 |
3 |
0.139 |
|
|
|
|
|
| photosynthesis |
FunCat |
21 |
0.000 |
3 |
0.000 |
|
|
|
|
|
| Protein folding / chaperonins (chloroplast) |
BioPath |
20 |
0.000 |
2 |
0.001 |
|
|
|
|
|
| phospholipid desaturation pathway |
AraCyc |
20 |
0.000 |
2 |
0.000 |
|
|
|
|
|
| 1,1,1-Trichloro-2,2-bis(4-chlorophenyl)ethane (DDT) degradatio |
KEGG |
20 |
0.000 |
2 |
0.000 |
|
|
|
|
|
|
|
|
|
|
|
| 1,1,1-Trichloro-2,2-bis(4-chlorophenyl)ethane (DDT) degradation |
KEGG |
20 |
0.000 |
2 |
0.000 |
|
|
|
|
|
|
|
|
|
|
|
| Androgen and estrogen metabolism |
KEGG |
20 |
0.000 |
2 |
0.000 |
|
|
|
|
|
|
|
|
|
|
|
| Benzoate degradation via hydroxylation |
KEGG |
20 |
0.000 |
2 |
0.000 |
|
|
|
|
|
|
|
|
|
|
|
| Chlorophyll biosynthesis and breakdown |
BioPath |
16 |
0.000 |
2 |
0.009 |
|
|
|
|
|
|
|
|
|
|
|
| Plastidial Isoprenoids (Chlorophylls, Carotenoids, Tocopherols, Plastoquinone, Phylloquinone) |
BioPath |
16 |
0.011 |
2 |
0.094 |
|
|
|
|
|
|
|
|
|
|
|
| chlorophyll biosynthesis |
AraCyc |
16 |
0.000 |
2 |
0.006 |
|
|
|
|
|
|
|
|
|
|
|
| Folding, Sorting and Degradation |
KEGG |
16 |
0.000 |
3 |
0.015 |
|
|
|
|
|
|
|
|
|
|
|
| Porphyrin and chlorophyll metabolism |
KEGG |
16 |
0.000 |
2 |
0.002 |
|
|
|
|
|
|
|
|
|
|
|
| chlorophyll and phytochromobilin metabolism |
LitPath |
16 |
0.000 |
2 |
0.005 |
|
|
|
|
|
|
|
|
|
|
|
| mRNA processing in chloroplast |
BioPath |
14 |
0.000 |
4 |
0.000 |
|
|
|
|
|
|
|
|
|
|
|
| plastid large ribosomal subunit |
TAIR-GO |
12 |
0.000 |
2 |
0.000 |
|
|
|
|
|
|
|
|
|
|
|
| protein biosynthesis |
TAIR-GO |
12 |
0.000 |
2 |
0.000 |
|
|
|
|
|
|
|
|
|
|
|
| biosynthesis of vitamins, cofactors, and prosthetic groups |
FunCat |
12 |
0.000 |
2 |
0.000 |
|
|
|
|
|
|
|
|
|
|
|
| protein synthesis |
FunCat |
12 |
0.003 |
4 |
0.002 |
|
|
|
|
|
|
|
|
|
|
|
| Protein folding and associated processing |
KEGG |
12 |
0.000 |
2 |
0.002 |
|
|
|
|
|
|
|
|
|
|
|
|
|
|
|
|
|
|
|
|
|
|
|
|
|
|
|
|
|
|
|
|
|
|
|
|
|
|
|
|
|
|
|
|
|
|
|
|
|
|
|
|
|
|
|
|
|
|
|
|
|
|
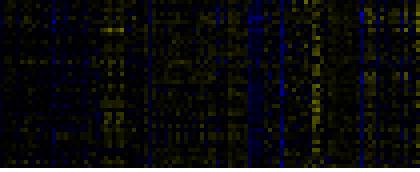
| Pathways co-expressed in the Mutant data set (with more than 6 annotation points) |
|
CYP97C1, LUT1 (At3g53130) |
|
|
|
|
|
|
|
|
| max. difference between log2-ratios: |
3.2 |
|
|
|
|
|
|
|
|
|
|
|
|
| max. difference between log2-ratios excluding lowest and highest 5%: |
0.9 |
|
|
|
|
|
|
|
|
|
|
|
|
| Pathway |
Source |
Scores of Genes |
p[Score] |
No. of Genes |
p[genes] |
Link to mutants heatmap |
|
|
|
|
|
|
|
| Cell Wall Carbohydrate Metabolism |
BioPath |
10 |
0.005 |
1 |
0.168 |

|
|
|
|
| mRNA processing in chloroplast |
BioPath |
10 |
0.000 |
1 |
0.000 |
|
|
|
| pectin metabolism |
BioPath |
10 |
0.000 |
1 |
0.041 |
|
|
|
| Translation (chloroplast) |
BioPath |
10 |
0.000 |
1 |
0.000 |
|
|
|
| protein modification |
FunCat |
10 |
0.000 |
1 |
0.000 |
|
|
|
|
|
|
|
|
|
|
|
| Pentose and glucuronate interconversions |
KEGG |
10 |
0.000 |
1 |
0.000 |
|
|
|
|
|
|
|
|
|
|
|
| Starch and sucrose metabolism |
KEGG |
10 |
0.000 |
1 |
0.007 |
|
|
|
|
|
|
|
|
|
|
|
| carotenoid biosynthesis |
TAIR-GO |
9 |
0.000 |
1 |
0.000 |
|
|
|
|
|
|
|
|
|
|
|
| Carotenoid and abscisic acid metabolism |
LitPath |
9 |
0.000 |
1 |
0.003 |
|
|
|
|
|
|
|
|
|
|
|
| carotenoid degradation |
LitPath |
9 |
0.000 |
1 |
0.000 |
|
|
|
|
|
|
|
|
|
|
|
|
|
|
|
|
|
|
|
|
|
|
|
|
|
|
|
|