|
|
|
|
|
|
|
|
|
|
|
|
|
|
|
|
|
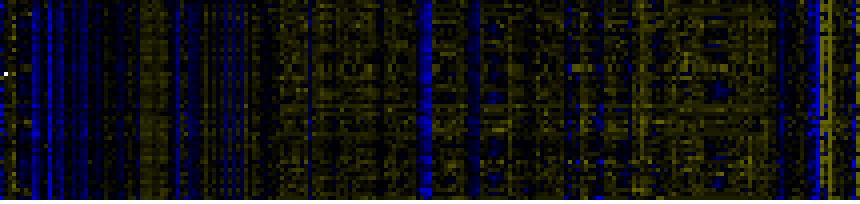
| Pathways co-expressed in the Stress data set ( with more than 70 annotation points) |
|
CYP88A4, KAO2 (At2g32440) |
|
|
|
|
|
|
|
|
| max. difference between log2-ratios: |
2.9 |
|
|
|
|
|
|
|
|
|
|
|
|
| max. difference between log2-ratios excluding lowest and highest 5%: |
1.3 |
|
|
|
|
|
|
|
|
|
|
|
|
| Pathway |
Source |
Scores of Genes |
p[Score] |
No. of Genes |
p[genes] |
Link to stress heatmap |
|
|
|
|
|
|
|
| Plastidial Isoprenoids (Chlorophylls, Carotenoids, Tocopherols, Plastoquinone, Phylloquinone) |
BioPath |
301 |
0.000 |
36 |
0.000 |
|
| Photosystems |
BioPath |
276 |
0.000 |
45 |
0.000 |
| C-compound and carbohydrate metabolism |
FunCat |
236 |
0.000 |
40 |
0.001 |
| biogenesis of chloroplast |
FunCat |
187 |
0.000 |
29 |
0.000 |
| Intermediary Carbon Metabolism |
BioPath |
180 |
0.000 |
28 |
0.120 |
| photosynthesis |
FunCat |
168 |
0.000 |
27 |
0.000 |
| Chlorophyll biosynthesis and breakdown |
BioPath |
151 |
0.000 |
18 |
0.000 |
| chlorophyll and phytochromobilin metabolism |
LitPath |
145 |
0.000 |
17 |
0.000 |
| glycolysis and gluconeogenesis |
FunCat |
129 |
0.000 |
20 |
0.003 |
| Photosynthesis |
KEGG |
123 |
0.000 |
23 |
0.000 |
| Carbon fixation |
KEGG |
115 |
0.000 |
18 |
0.000 |
| additional photosystem II components |
BioPath |
113 |
0.000 |
18 |
0.000 |
| Porphyrin and chlorophyll metabolism |
KEGG |
109 |
0.000 |
13 |
0.000 |
|
|
|
|
|
|
|
|
|
|
|
| Glycolysis / Gluconeogenesis |
KEGG |
108 |
0.000 |
16 |
0.000 |
|
|
|
|
|
|
|
|
|
|
|
| chlorophyll biosynthesis |
AraCyc |
106 |
0.000 |
13 |
0.001 |
|
|
|
|
|
|
|
|
|
|
|
| Photosystem I |
BioPath |
87 |
0.000 |
16 |
0.003 |
|
|
|
|
|
|
|
|
|
|
|
| Calvin cycle |
AraCyc |
87 |
0.000 |
17 |
0.000 |
|
|
|
|
|
|
|
|
|
|
|
| chlorophyll biosynthesis |
TAIR-GO |
85 |
0.000 |
9 |
0.000 |
|
|
|
|
|
|
|
|
|
|
|
| Leaf Glycerolipid Biosynthesis in Plastid |
BioPath |
77 |
0.048 |
10 |
0.219 |
|
|
|
|
|
|
|
|
|
|
|
| Pentose phosphate pathway |
KEGG |
77 |
0.000 |
13 |
0.000 |
|
|
|
|
|
|
|
|
|
|
|
|
|
|
|
|
|
|
|
|
|
|
|
|
|
|
|
|
|
|
|
|
|
|
|
|
|
|
|
|
|
|
|
|
|
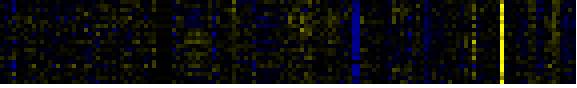
| Pathways co-expressed in the Hormone etc. data set (with more than 6 annotation points) |
|
CYP88A4, KAO2 (At2g32440) |
|
|
|
|
|
|
|
|
| max. difference between log2-ratios: |
1.3 |
|
|
|
|
|
|
|
|
|
|
|
|
| max. difference between log2-ratios excluding lowest and highest 5%: |
0.8 |
|
|
|
|
|
|
|
|
|
|
|
|
| Pathway |
Source |
Scores of Genes |
p[Score] |
No. of Genes |
p[genes] |
Link to hormones etc. heatmap |
|
|
|
|
|
|
|
| Chlorophyll biosynthesis and breakdown |
BioPath |
10 |
0.000 |
1 |
0.000 |

|
|
|
|
|
|
| Plastidial Isoprenoids (Chlorophylls, Carotenoids, Tocopherols, Plastoquinone, Phylloquinone) |
BioPath |
10 |
0.000 |
1 |
0.003 |
|
|
|
|
|
| chlorophyll biosynthesis |
TAIR-GO |
10 |
0.000 |
1 |
0.000 |
|
|
|
|
|
|
|
|
|
|
|
| chlorophyll biosynthesis |
AraCyc |
10 |
0.000 |
1 |
0.010 |
|
|
|
|
|
|
|
|
|
|
|
| Diterpenoid biosynthesis |
KEGG |
10 |
0.000 |
1 |
0.000 |
|
|
|
|
|
|
|
|
|
|
|
| Porphyrin and chlorophyll metabolism |
KEGG |
10 |
0.000 |
1 |
0.000 |
|
|
|
|
|
|
|
|
|
|
|
| chlorophyll and phytochromobilin metabolism |
LitPath |
10 |
0.000 |
1 |
0.013 |
|
|
|
|
|
|
|
|
|
|
|
| chlorophyll biosynthesis |
LitPath |
10 |
0.000 |
1 |
0.001 |
|
|
|
|
|
|
|
|
|
|
|
| Gibberellin metabolism |
LitPath |
10 |
0.000 |
1 |
0.003 |
|
|
|
|
|
|
|
|
|
|
|
| giberelin biosynthesis |
LitPath |
10 |
0.000 |
1 |
0.002 |
|
|
|
|
|
|
|
|
|
|
|
|
|
|
|
|
|
|
|
|
|
|
|
|
|
|
|
|
|
|
|
|
|
|
|
|
|
|
|
|
|
|
|
|
|
|
|
|
|
|
|
|
|
|
|
|
|
|
|
|
|
|
| Pathways co-expressed in the Mutant data set (with more than 10 annotation points) |
|
CYP88A4, KAO2 (At2g32440) |
|
|
|
|
|
|
|
|
| max. difference between log2-ratios: |
2.5 |
|
|
|
|
|
|
|
|
|
|
|
|
| max. difference between log2-ratios excluding lowest and highest 5%: |
1.1 |
|
|
|
|
|
|
|
|
|
|
|
|
| Pathway |
Source |
Scores of Genes |
p[Score] |
No. of Genes |
p[genes] |
Link to mutants heatmap |
|
|
|
|
|
|
|
| Plastidial Isoprenoids (Chlorophylls, Carotenoids, Tocopherols, Plastoquinone, Phylloquinone) |
BioPath |
28 |
0.000 |
3 |
0.003 |
|
|
|
|
| Carotenoid biosynthesis |
BioPath |
18 |
0.000 |
2 |
0.000 |
|
|
|
| carotenoid biosynthesis |
AraCyc |
18 |
0.000 |
2 |
0.000 |
|
|
|
| carotenid biosynthesis |
LitPath |
18 |
0.000 |
2 |
0.000 |
|
|
|
| Carotenoid and abscisic acid metabolism |
LitPath |
18 |
0.000 |
2 |
0.001 |
|
|
|
| Biosynthesis of Amino Acids and Derivatives |
BioPath |
16 |
0.008 |
2 |
0.126 |
|
|
|
| Methionin/SAM/ethylene metabolism from cysteine and aspartate |
BioPath |
16 |
0.000 |
2 |
0.001 |
|
|
|
|
|
|
|
|
|
|
|
| Nitrogen metabolism |
KEGG |
12 |
0.000 |
2 |
0.000 |
|
|
|
|
|
|
|
|
|
|
|
| Chlorophyll biosynthesis and breakdown |
BioPath |
10 |
0.000 |
1 |
0.025 |
|
|
|
|
|
|
|
|
|
|
|
| carotene biosynthesis |
TAIR-GO |
10 |
0.000 |
1 |
0.000 |
|
|
|
|
|
|
|
|
|
|
|
| chlorophyll biosynthesis |
TAIR-GO |
10 |
0.000 |
1 |
0.004 |
|
|
|
|
|
|
|
|
|
|
|
| methionine biosynthesis |
TAIR-GO |
10 |
0.000 |
1 |
0.000 |
|
|
|
|
|
|
|
|
|
|
|
| methionine biosynthesis from L-homoserine via cystathione |
TAIR-GO |
10 |
0.000 |
1 |
0.000 |
|
|
|
|
|
|
|
|
|
|
|
| chlorophyll biosynthesis |
AraCyc |
10 |
0.000 |
1 |
0.020 |
|
|
|
|
|
|
|
|
|
|
|
| homocysteine and cysteine interconversion |
AraCyc |
10 |
0.000 |
1 |
0.001 |
|
|
|
|
|
|
|
|
|
|
|
| methionine biosynthesis II |
AraCyc |
10 |
0.000 |
1 |
0.001 |
|
|
|
|
|
|
|
|
|
|
|
| sulfate assimilation III |
AraCyc |
10 |
0.000 |
1 |
0.008 |
|
|
|
|
|
|
|
|
|
|
|
| amino acid metabolism |
FunCat |
10 |
0.000 |
1 |
0.015 |
|
|
|
|
|
|
|
|
|
|
|
| Biosynthesis of steroids |
KEGG |
10 |
0.000 |
1 |
0.017 |
|
|
|
|
|
|
|
|
|
|
|
| Cysteine metabolism |
KEGG |
10 |
0.000 |
1 |
0.006 |
|
|
|
|
|
|
|
|
|
|
|
| Diterpenoid biosynthesis |
KEGG |
10 |
0.000 |
1 |
0.001 |
|
|
|
|
|
|
|
|
|
|
|
| Methionine metabolism |
KEGG |
10 |
0.000 |
1 |
0.003 |
|
|
|
|
|
|
|
|
|
|
|
| Selenoamino acid metabolism |
KEGG |
10 |
0.000 |
1 |
0.007 |
|
|
|
|
|
|
|
|
|
|
|
| Sulfur metabolism |
KEGG |
10 |
0.000 |
1 |
0.004 |
|
|
|
|
|
|
|
|
|
|
|
| chlorophyll and phytochromobilin metabolism |
LitPath |
10 |
0.005 |
1 |
0.053 |
|
|
|
|
|
|
|
|
|
|
|
| chlorophyll biosynthesis |
LitPath |
10 |
0.000 |
1 |
0.004 |
|
|
|
|
|
|
|
|
|
|
|
| Gibberellin metabolism |
LitPath |
10 |
0.000 |
1 |
0.015 |
|
|
|
|
|
|
|
|
|
|
|
| giberelin biosynthesis |
LitPath |
10 |
0.000 |
1 |
0.009 |
|
|
|
|
|
|
|
|
|
|
|
|
|
|
|
|
|
|
|
|
|
|
|
|
|
|
|
|