| _________________________________________ |
|
|
|
|
|
|
|
|
|
|
|
|
|
|
|
| Pathways co-expressed in all 4 data sets (with more than 6 annotation points each) |
|
Find below a list of pathways that are co-expressed with the bait. First a list of pathways is given that are co-expressed in all data sets. Lists for each individual dataset are shown underneath. Depending on the number of co-expressed pathways only the top scoring pathways are given; all data can be saved as text using the link above. |
|
|
|
|
|
|
| Pathway |
Source |
Sum of scores |
Sum of genes |
|
|
|
|
|
|
|
| Plastidial Isoprenoids (Chlorophylls, Carotenoids, Tocopherols, Plastoquinone, Phylloquinone) |
BioPath |
870 |
108 |
|
|
|
|
|
|
|
| C-compound and carbohydrate metabolism |
FunCat |
691 |
122 |
|
|
|
|
|
|
|
| biogenesis of chloroplast |
FunCat |
594 |
92 |
|
|
|
|
|
|
|
|
|
| chlorophyll biosynthesis |
AraCyc |
592 |
70 |
|
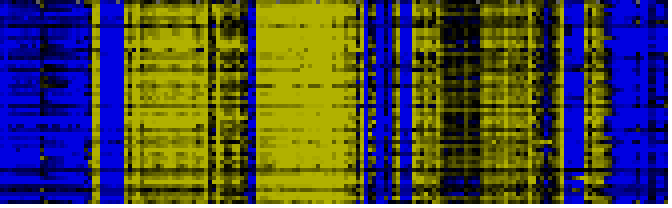
To the right of each table a thumbnail of the actual co-expression heatmap is given. Klick on the link to see the heatmap containing all co-expressed genes. |
|
|
|
|
|
|
|
|
| photosynthesis |
FunCat |
587 |
89 |
|
|
|
|
|
|
|
|
|
| chlorophyll biosynthesis |
TAIR-GO |
537 |
61 |
|
|
|
|
|
|
|
|
|
| chlorophyll biosynthesis |
LitPath |
511 |
58 |
|
For more information on how these pathway maps were generated please read the methods page |
|
|
|
|
|
|
|
|
| photosynthesis |
TAIR-GO |
503 |
72 |
|
|
|
|
|
|
|
|
|
| Chlorophyll biosynthesis and breakdown |
BioPath |
431 |
51 |
|
|
|
|
|
|
|
|
|
|
|
|
|
| glycolysis and gluconeogenesis |
FunCat |
418 |
70 |
|
|
|
|
|
|
|
|
|
|
|
|
|
| chlorophyll and phytochromobilin metabolism |
LitPath |
413 |
48 |
|
|
|
|
|
|
|
|
|
|
|
|
|
| Carbon fixation |
KEGG |
395 |
63 |
|
|
|
|
|
|
|
|
|
|
|
|
|
| additional photosystem II components |
BioPath |
390 |
58 |
|
|
|
|
|
|
|
|
|
|
|
|
|
| Porphyrin and chlorophyll metabolism |
KEGG |
355 |
42 |
|
|
|
|
|
|
|
|
|
|
|
|
|
| Glycolysis / Gluconeogenesis |
KEGG |
298 |
46 |
|
|
|
|
|
|
|
|
|
|
|
|
|
| Calvin cycle |
AraCyc |
264 |
51 |
|
|
|
|
|
|
|
|
|
|
|
|
|
| transport |
FunCat |
257.5 |
43 |
|
|
|
|
|
|
|
|
|
|
|
|
|
| Biosynthesis of steroids |
KEGG |
257 |
28 |
|
|
|
|
|
|
|
|
|
|
|
|
|
| carotenoid biosynthesis |
AraCyc |
244 |
27 |
|
|
|
|
|
|
|
|
|
|
|
|
|
| photorespiration |
AraCyc |
226 |
48 |
|
|
|
|
|
|
|
|
|
|
|
|
|
| photosystem I |
TAIR-GO |
223 |
27 |
|
|
|
|
|
|
|
|
|
|
|
|
|
| carotenoid biosynthesis |
TAIR-GO |
215 |
24 |
|
|
|
|
|
|
|
|
|
|
|
|
|
| gluconeogenesis |
AraCyc |
213 |
33 |
|
|
|
|
|
|
|
|
|
|
|
|
|
| Carotenoid and abscisic acid metabolism |
LitPath |
211 |
25 |
|
|
|
|
|
|
|
|
|
|
|
|
|
| glycolysis IV |
AraCyc |
210 |
40 |
|
|
|
|
|
|
|
|
|
|
|
|
|
| more common pathways in Tab Delimited form only |
|
|
|
|
|
|
|
|
|
|
|
|
|
|
|
|
|
|
|
|
|
|
|
|
|
|
|
|
|
|
|
|
|
|
|
|
|
|
|
|
|
|
|
|
|
|
|
| Pathways co-expressed in the Organ and Tissue data set (with more than 70 annotation points) |
|
CYP97A3 (At1g31800) |
|
|
|
|
|
|
|
|
| max. difference between log2-ratios: |
4.9 |
|
|
|
|
|
|
|
|
|
|
|
|
| max. difference between log2-ratios excluding lowest and highest 5%: |
3.6 |
|
|
|
|
|
|
|
|
|
|
|
|
| Pathway |
Source |
Scores of Genes |
p[Score] |
No. of Genes |
p[genes] |
Link to organ heatmap |
|
|
|
|
|
|
|
| Photosystems |
BioPath |
494 |
0.000 |
73 |
0.000 |
|
|
|
|
|
|
|
|
|
|
|
| Plastidial Isoprenoids (Chlorophylls, Carotenoids, Tocopherols, Plastoquinone, Phylloquinone) |
BioPath |
341 |
0.000 |
43 |
0.000 |
|
|
|
| C-compound and carbohydrate metabolism |
FunCat |
213 |
0.000 |
40 |
0.014 |
|
|
| additional photosystem II components |
BioPath |
209 |
0.000 |
30 |
0.000 |
|
|
| biogenesis of chloroplast |
FunCat |
209 |
0.000 |
32 |
0.000 |
|
|
| Photosystem I |
BioPath |
189 |
0.000 |
29 |
0.000 |
|
|
| photosynthesis |
FunCat |
184 |
0.000 |
29 |
0.000 |
|
|
| Chlorophyll biosynthesis and breakdown |
BioPath |
183 |
0.000 |
22 |
0.000 |
|
|
| chlorophyll and phytochromobilin metabolism |
LitPath |
177 |
0.000 |
21 |
0.000 |
|
|
| Photosynthesis |
KEGG |
159 |
0.000 |
28 |
0.000 |
|
|
| photosystem I |
TAIR-GO |
149 |
0.000 |
18 |
0.000 |
|
|
| Chlorophyll a/b binding proteins |
BioPath |
146 |
0.000 |
18 |
0.000 |
|
|
| glycolysis and gluconeogenesis |
FunCat |
143 |
0.000 |
24 |
0.001 |
|
|
| Porphyrin and chlorophyll metabolism |
KEGG |
141 |
0.000 |
17 |
0.000 |
|
|
| chlorophyll biosynthesis |
AraCyc |
140 |
0.000 |
18 |
0.000 |
|
|
|
|
|
|
|
|
|
|
|
| Carbon fixation |
KEGG |
129 |
0.000 |
20 |
0.000 |
|
|
|
|
|
|
|
|
|
|
|
| Photosystem II |
BioPath |
121 |
0.000 |
16 |
0.001 |
|
|
|
|
|
|
|
|
|
|
|
| photosystem II |
TAIR-GO |
116 |
0.000 |
14 |
0.000 |
|
|
|
|
|
|
|
|
|
|
|
| transport |
FunCat |
107 |
0.000 |
17 |
0.000 |
|
|
|
|
|
|
|
|
|
|
|
| photosynthesis |
TAIR-GO |
100 |
0.000 |
12 |
0.000 |
|
|
|
|
|
|
|
|
|
|
|
| Calvin cycle |
AraCyc |
93 |
0.000 |
17 |
0.000 |
|
|
|
|
|
|
|
|
|
|
|
| Biosynthesis of steroids |
KEGG |
86 |
0.000 |
10 |
0.001 |
|
|
|
|
|
|
|
|
|
|
|
| chlorophyll biosynthesis |
TAIR-GO |
85 |
0.000 |
9 |
0.000 |
|
|
|
|
|
|
|
|
|
|
|
| chlorophyll binding |
TAIR-GO |
80 |
0.000 |
9 |
0.000 |
|
|
|
|
|
|
|
|
|
|
|
| biosynthesis of proto- and siroheme |
AraCyc |
80 |
0.000 |
12 |
0.001 |
|
|
|
|
|
|
|
|
|
|
|
| Folding, Sorting and Degradation |
KEGG |
77 |
0.002 |
12 |
0.121 |
|
|
|
|
|
|
|
|
|
|
|
| Carotenoid and abscisic acid metabolism |
LitPath |
75 |
0.000 |
9 |
0.000 |
|
|
|
|
|
|
|
|
|
|
|
| Glycolysis / Gluconeogenesis |
KEGG |
72 |
0.000 |
11 |
0.028 |
|
|
|
|
|
|
|
|
|
|
|
|
|
|
|
|
|
|
|
|
|
|
|
|
|
|
|
|
|
|
|
|
|
|
|
|
|
|
|
|
|
|
|
|
|
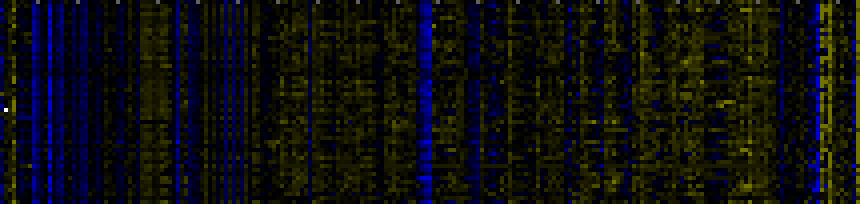
| Pathways co-expressed in the Stress data set ( with more than 80 annotation points) |
|
CYP97A3 (At1g31800) |
|
|
|
|
|
|
|
|
| max. difference between log2-ratios: |
2.7 |
|
|
|
|
|
|
|
|
|
|
|
|
| max. difference between log2-ratios excluding lowest and highest 5%: |
1.4 |
|
|
|
|
|
|
|
|
|
|
|
|
| Pathway |
Source |
Scores of Genes |
p[Score] |
No. of Genes |
p[genes] |
Link to stress heatmap |
|
|
|
|
|
|
|
| Plastidial Isoprenoids (Chlorophylls, Carotenoids, Tocopherols, Plastoquinone, Phylloquinone) |
BioPath |
239 |
0.000 |
28 |
0.000 |
|
| C-compound and carbohydrate metabolism |
FunCat |
210 |
0.000 |
36 |
0.001 |
| Photosystems |
BioPath |
207 |
0.000 |
34 |
0.000 |
| Intermediary Carbon Metabolism |
BioPath |
174 |
0.000 |
26 |
0.024 |
| photosynthesis |
FunCat |
153 |
0.000 |
24 |
0.000 |
| biogenesis of chloroplast |
FunCat |
127 |
0.000 |
21 |
0.000 |
| glycolysis and gluconeogenesis |
FunCat |
127 |
0.000 |
20 |
0.000 |
| Chlorophyll biosynthesis and breakdown |
BioPath |
115 |
0.000 |
13 |
0.000 |
| chlorophyll and phytochromobilin metabolism |
LitPath |
109 |
0.000 |
12 |
0.000 |
| Glycolysis / Gluconeogenesis |
KEGG |
108 |
0.000 |
16 |
0.000 |
| Carbon fixation |
KEGG |
104 |
0.000 |
17 |
0.000 |
| Porphyrin and chlorophyll metabolism |
KEGG |
91 |
0.000 |
10 |
0.000 |
| Photosynthesis |
KEGG |
88 |
0.000 |
17 |
0.000 |
| chlorophyll biosynthesis |
AraCyc |
82 |
0.000 |
10 |
0.006 |
|
|
|
|
|
|
|
|
|
|
|
| Calvin cycle |
AraCyc |
81 |
0.000 |
16 |
0.000 |
|
|
|
|
|
|
|
|
|
|
|
|
|
|
|
|
|
|
|
|
|
|
|
|
|
|
|
|
|
|
|
|
|
|
|
|
|
|
|
|
|
|
|
|
|
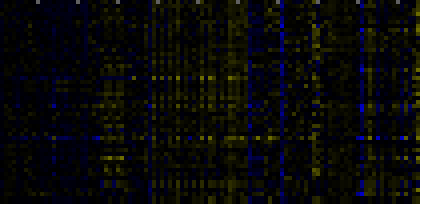
| Pathways co-expressed in the Hormone etc. data set (with more than 28 annotation points) |
|
CYP97A3 (At1g31800) |
|
|
|
|
|
|
|
|
| max. difference between log2-ratios: |
1.9 |
|
|
|
|
|
|
|
|
|
|
|
|
| max. difference between log2-ratios excluding lowest and highest 5%: |
0.7 |
|
|
|
|
|
|
|
|
|
|
|
|
| Pathway |
Source |
Scores of Genes |
p[Score] |
No. of Genes |
p[genes] |
Link to hormones etc. heatmap |
|
|
|
|
|
|
|
| biogenesis of chloroplast |
FunCat |
67 |
0.000 |
10 |
0.000 |
|
|
|
|
|
|
| C-compound and carbohydrate metabolism |
FunCat |
65 |
0.000 |
11 |
0.051 |
|
|
|
|
|
| photosynthesis |
FunCat |
65 |
0.000 |
10 |
0.000 |
|
|
|
|
|
| Plastidial Isoprenoids (Chlorophylls, Carotenoids, Tocopherols, Plastoquinone, Phylloquinone) |
BioPath |
58 |
0.000 |
8 |
0.000 |
|
|
|
|
|
| glycolysis and gluconeogenesis |
FunCat |
49 |
0.000 |
8 |
0.004 |
|
|
|
|
|
| Intermediary Carbon Metabolism |
BioPath |
48 |
0.000 |
7 |
0.077 |
|
|
|
|
|
| Carbon fixation |
KEGG |
44 |
0.000 |
7 |
0.000 |
|
|
|
|
|
| Glycolysis / Gluconeogenesis |
KEGG |
44 |
0.000 |
6 |
0.003 |
|
|
|
|
|
| Folding, Sorting and Degradation |
KEGG |
40 |
0.000 |
5 |
0.047 |
|
|
|
|
|
| Leaf Glycerolipid Biosynthesis in Plastid |
BioPath |
37 |
0.000 |
4 |
0.022 |
|
|
|
|
|
| glycosylglyceride desaturation pathway |
AraCyc |
37 |
0.000 |
4 |
0.000 |
|
|
|
|
|
| Synthesis of membrane lipids in plastids |
AcylLipid |
37 |
0.000 |
4 |
0.000 |
|
|
|
|
|
| gluconeogenesis |
AraCyc |
34 |
0.000 |
5 |
0.009 |
|
|
|
|
|
| Protein folding / chaperonins (chloroplast) |
BioPath |
30 |
0.000 |
3 |
0.001 |
|
|
|
|
|
|
|
|
|
|
|
| Calvin cycle |
AraCyc |
30 |
0.000 |
7 |
0.000 |
|
|
|
|
|
|
|
|
|
|
|
| phospholipid desaturation pathway |
AraCyc |
30 |
0.000 |
3 |
0.000 |
|
|
|
|
|
|
|
|
|
|
|
| 1,1,1-Trichloro-2,2-bis(4-chlorophenyl)ethane (DDT) degradatio |
KEGG |
30 |
0.000 |
3 |
0.000 |
|
|
|
|
|
|
|
|
|
|
|
| 1,1,1-Trichloro-2,2-bis(4-chlorophenyl)ethane (DDT) degradation |
KEGG |
30 |
0.000 |
3 |
0.000 |
|
|
|
|
|
|
|
|
|
|
|
| Androgen and estrogen metabolism |
KEGG |
30 |
0.000 |
3 |
0.000 |
|
|
|
|
|
|
|
|
|
|
|
| Benzoate degradation via hydroxylation |
KEGG |
30 |
0.000 |
3 |
0.000 |
|
|
|
|
|
|
|
|
|
|
|
| Carotenoid and abscisic acid metabolism |
LitPath |
29 |
0.000 |
4 |
0.000 |
|
|
|
|
|
|
|
|
|
|
|
|
|
|
|
|
|
|
|
|
|
|
|
|
|
|
|
|
|
|
|
|
|
|
|
|
|
|
|
|
|
|
|
|
|
|
|
|
|
|
|
|
|
|
|
|
|
|
|
|
|
|
| Pathways co-expressed in the Mutant data set (with more than 58 annotation points) |
|
CYP97A3 (At1g31800) |
|
|
|
|
|
|
|
|
| max. difference between log2-ratios: |
3.0 |
|
|
|
|
|
|
|
|
|
|
|
|
| max. difference between log2-ratios excluding lowest and highest 5%: |
0.9 |
|
|
|
|
|
|
|
|
|
|
|
|
| Pathway |
Source |
Scores of Genes |
p[Score] |
No. of Genes |
p[genes] |
Link to mutants heatmap |
|
|
|
|
|
|
|
| Plastidial Isoprenoids (Chlorophylls, Carotenoids, Tocopherols, Plastoquinone, Phylloquinone) |
BioPath |
232 |
0.000 |
29 |
0.000 |
|
|
|
|
| C-compound and carbohydrate metabolism |
FunCat |
203 |
0.000 |
35 |
0.021 |
|
|
|
| biogenesis of chloroplast |
FunCat |
191 |
0.000 |
29 |
0.000 |
|
|
|
| Photosystems |
BioPath |
178 |
0.000 |
24 |
0.002 |
|
|
|
| Intermediary Carbon Metabolism |
BioPath |
150 |
0.010 |
27 |
0.046 |
|
|
|
| photosynthesis |
FunCat |
127 |
0.000 |
19 |
0.000 |
|
|
|
| Carbon fixation |
KEGG |
118 |
0.000 |
19 |
0.000 |
|
|
|
| Chlorophyll biosynthesis and breakdown |
BioPath |
107 |
0.000 |
13 |
0.000 |
|
|
|
| chlorophyll and phytochromobilin metabolism |
LitPath |
101 |
0.000 |
12 |
0.000 |
|
|
|
| glycolysis and gluconeogenesis |
FunCat |
99 |
0.000 |
18 |
0.018 |
|
|
|
| amino acid metabolism |
FunCat |
97 |
0.011 |
12 |
0.206 |
|
|
|
| Porphyrin and chlorophyll metabolism |
KEGG |
97 |
0.000 |
12 |
0.000 |
|
|
|
| Biosynthesis of steroids |
KEGG |
95 |
0.000 |
10 |
0.004 |
|
|
|
| chlorophyll biosynthesis |
AraCyc |
90 |
0.000 |
12 |
0.005 |
|
|
|
|
|
|
|
|
|
|
|
| chlorophyll biosynthesis |
TAIR-GO |
85 |
0.000 |
9 |
0.000 |
|
|
|
|
|
|
|
|
|
|
|
| transport |
FunCat |
83 |
0.000 |
14 |
0.000 |
|
|
|
|
|
|
|
|
|
|
|
| Folding, Sorting and Degradation |
KEGG |
80 |
0.024 |
12 |
0.241 |
|
|
|
|
|
|
|
|
|
|
|
| additional photosystem II components |
BioPath |
78 |
0.000 |
11 |
0.003 |
|
|
|
|
|
|
|
|
|
|
|
| Leaf Glycerolipid Biosynthesis in Plastid |
BioPath |
78 |
0.006 |
9 |
0.199 |
|
|
|
|
|
|
|
|
|
|
|
| Glycolysis / Gluconeogenesis |
KEGG |
74 |
0.000 |
13 |
0.015 |
|
|
|
|
|
|
|
|
|
|
|
| fatty acid biosynthesis |
TAIR-GO |
72 |
0.000 |
8 |
0.000 |
|
|
|
|
|
|
|
|
|
|
|
| triterpene, sterol, and brassinosteroid metabolism |
LitPath |
70 |
0.015 |
7 |
0.515 |
|
|
|
|
|
|
|
|
|
|
|
| Biosynthesis of prenyl diphosphates |
BioPath |
65 |
0.009 |
8 |
0.109 |
|
|
|
|
|
|
|
|
|
|
|
| photorespiration |
AraCyc |
62 |
0.000 |
12 |
0.000 |
|
|
|
|
|
|
|
|
|
|
|
| Pyruvate metabolism |
KEGG |
62 |
0.036 |
10 |
0.088 |
|
|
|
|
|
|
|
|
|
|
|
| sterol biosynthesis |
BioPath |
60 |
0.000 |
6 |
0.043 |
|
|
|
|
|
|
|
|
|
|
|
|
|
|
|
|
|
|
|
|
|
|
|
|
|
|
|
|